Glencore Stock Drops 0.06%, Testing Support Level In Focus
On October 28, 2026: price 541.50 GBp, trend downtrend, RSI 40.2, support 536.50, resistance 586.30. technical analysis of glencore stock.
Glencore shares have slipped 2.04% over five days and 2.47% over a month, and the latest session on Wednesday, October 28, 2026 did little to change that picture. For investors who track global commodities, the London-listed miner and trader is a bellwether for sentiment on copper, coal and other raw materials. The stock closed at 541.50 pence (GBp), down 0.06% on the day from a previous close of 541.80, according to exchange data via Yahoo Finance.
Why Glencore is in focus today
- Downtrend extending (5-day change -2.04%)
Selected automatically from 16 LSE (UK) stocks by a technical-signal score with daily weighted randomisation — not a recommendation.
Trend & Price Action
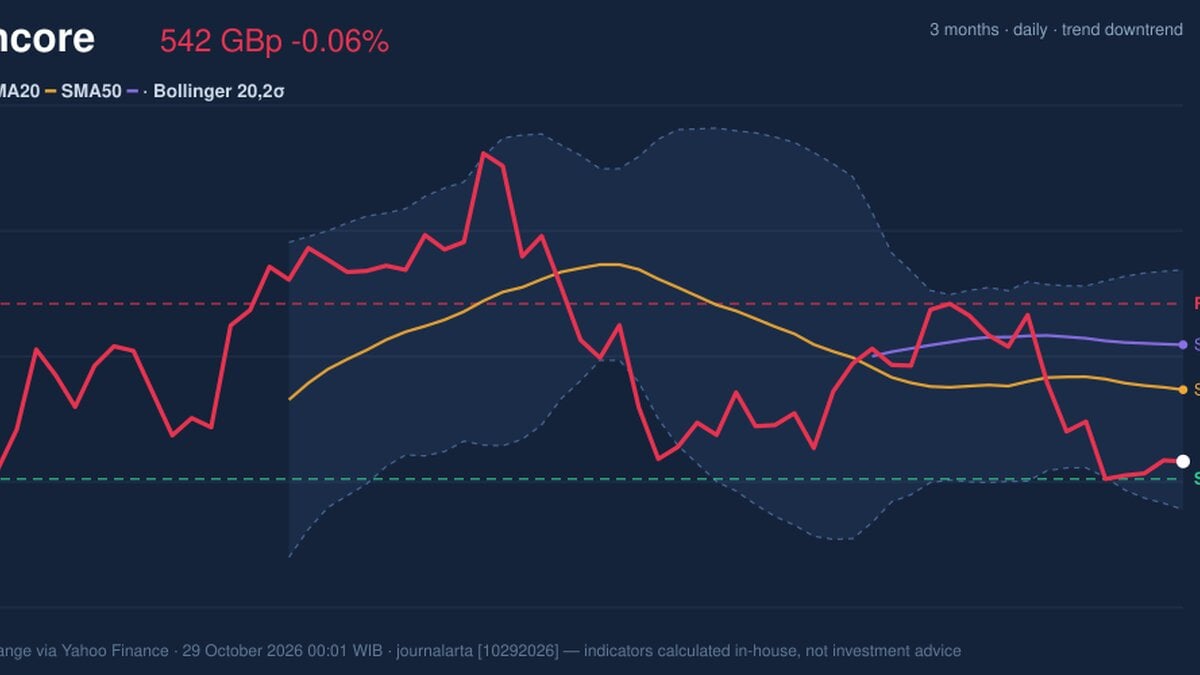
The one-day move is tiny, but the larger structure is soft. The price sits below its 20-day simple moving average (SMA20, the average closing price over the past 20 trading days) at 561.87 and below the 50-day average at 574.63. The stock is trading under both, and the 20-day average itself fell 0.65% over five days. In plain terms, the recent past is pulling the average down, and the price has not been able to climb back above it. The data show no new moving-average crossover, so the downtrend is a continuation rather than a fresh reversal.
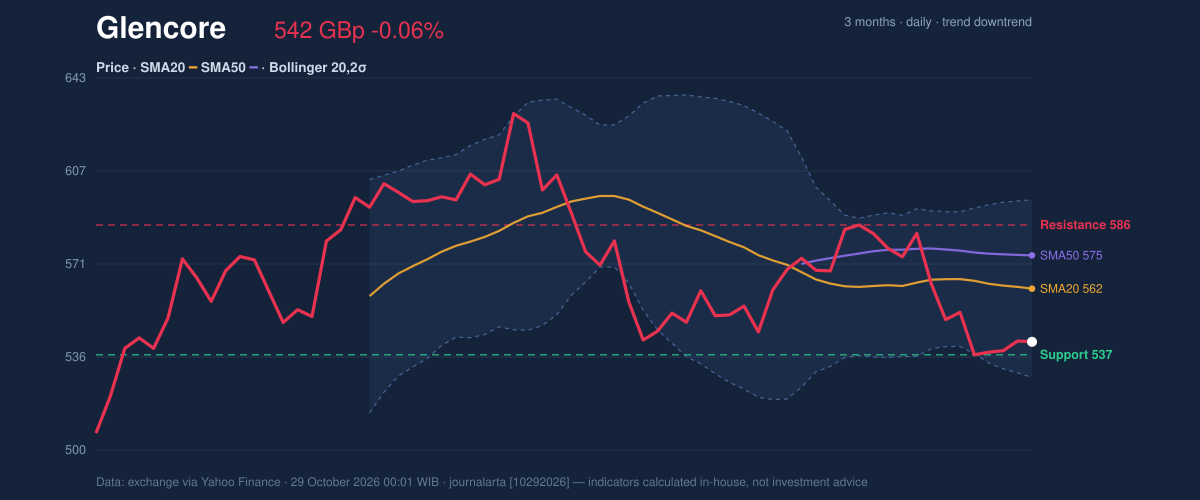
As the chart shows, the price sits near the lower part of its 20-day range, at about 10% of the span between support at 536.50 and resistance at 586.30. The wider three-month window runs from a low of 500.40 to a high of 669.30, so the shares remain well off their peak but also above the floor of that period. The gap to the 3-month low is worth noting: a drop through 536.50 would leave a fairly open path toward the 500 area, while the 50-day average overhead acts as a ceiling that sellers have so far defended.
Oscillators & Momentum
Momentum gauges are split, which is typical of a stock that has fallen but not collapsed. The Relative Strength Index (RSI), which measures the pace of recent gains against losses on a 0-100 scale, reads 40.2, neutral. It is leaning weak but is not at the extreme levels that usually signal exhaustion. The Stochastic oscillator, which compares the close with the recent trading range, is much lower: %K at 9.5 and %D at 8.8, an oversold reading. That means the close sits near the bottom of its recent range, which can precede a pause or bounce but does not by itself indicate one.
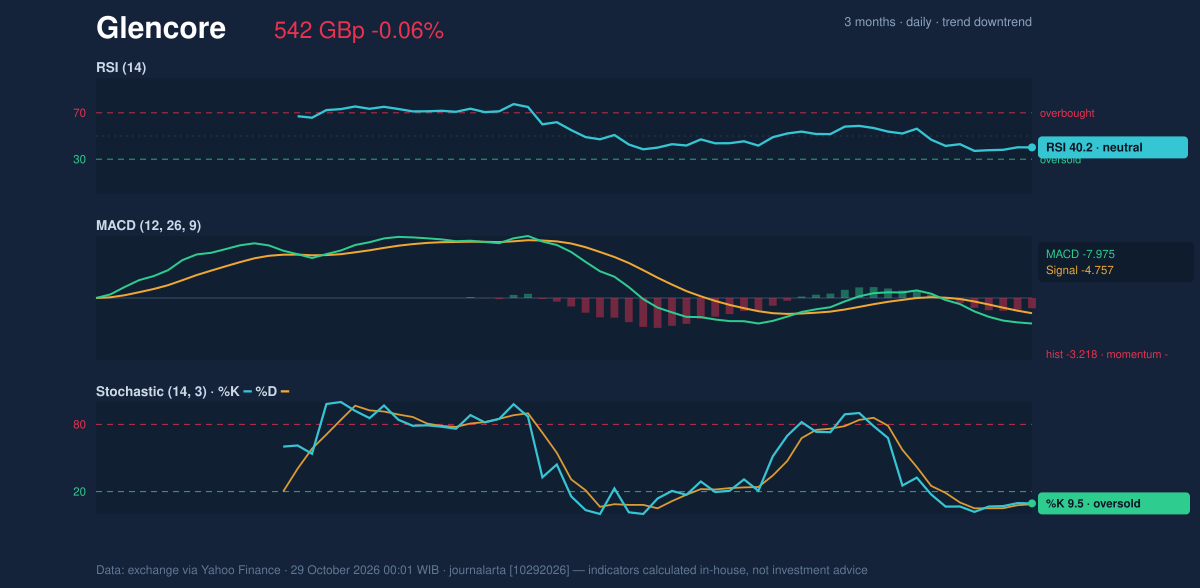
The MACD (a trend-following gauge built from two moving averages) is at -7.975, below its signal line of -4.757, leaving a histogram of -3.218. A negative and widening gap indicates that downward momentum is still in control. So the oscillators disagree on timing: Stochastic says the decline is stretched, while MACD says sellers still have the upper hand. Stochastic can stay oversold for long periods in a persistent downtrend.
Volatility & Volume
Bollinger Bands, which draw a channel two standard deviations around the 20-day average, span 527.80 to 595.94. The %B reading of 20% places the price in the lower fifth of that channel, and the band width of 12.1% is classed as normal, so there is no squeeze that would hint at a sudden breakout. The Average True Range (ATR), a measure of typical daily swing, is 23.02, or 4.3% of the price. That is high, so moves of this size in either direction would not be unusual, and levels can be breached on noise alone.
Participation is thin. Volume of 13,564,391 shares was only 0.4 times the 20-day average of 30,660,513. A quiet session suggests the latest drift lower was not driven by heavy selling, yet On-Balance Volume (OBV, a running tally that adds volume on up days and subtracts it on down days) is falling, which fits with a market where selling has outweighed buying over time.
Key Levels & Scenarios
The nearest floor is 536.50, only slightly below the last close, with the lower Bollinger band at 527.80 just beneath it. If the price fails to hold 536.50, the lower band and then the 500.40 three-month low come into focus. If it recovers, the first hurdles are the 20-day average at 561.87 and the 50-day at 574.63, with resistance at 586.30 above them.
Technical Verdict: HOLD (wait & see)
The indicators point to HOLD (wait & see) for three reasons:
- The price is below both the SMA20 and SMA50, and MACD is negative with a widening histogram, confirming a downtrend.
- Stochastic at 9.5 is oversold while RSI at 40.2 is neutral, so the move is stretched but not decisive.
- Volume at 0.4 times average and a falling OBV show a lack of conviction in any rebound.
The verdict would be invalidated if the price closes below 527.80 (the lower Bollinger band), which would open the way to the 500.40 low, or if it moves decisively above 586.30.
- Entry range (technical reference): 527.80-536.50, between the lower band and support.
- Exit target: 561.87 (SMA20), with 586.30 as the extended resistance.
- Stop loss: below 527.80; a break of 500.40 would signal deeper weakness.
In plain terms: the shares are weak but stretched to the downside, so the chart favours waiting for clearer direction rather than acting now. This is technical analysis, not investment advice.
| Indicator | Value |
|---|---|
| Last price | 541.50 GBp |
| SMA20 / SMA50 | 561.87 / 574.63 |
| Bollinger (lower / middle / upper) | 527.80 / 561.87 / 595.94 |
| RSI(14) | 40.2 |
| Stochastic %K / %D | 9.5 / 8.8 |
| MACD / signal / histogram | -7.975 / -4.757 / -3.218 |
| ATR(14) | 23.02 |
| Support / resistance (20 days) | 536.50 / 586.30 |
| 3-month low / high | 500.40 / 669.30 |
The next test comes at the Thursday session, when the price meets support at 536.50 on volume that has so far stayed well below its 20-day average.
Summary Data Glencore
| Last price | 541.50 GBp |
| Change 1 day / 5 days / 1 month | -0.06% / -2.04% / -2.47% |
| Trend / MA-cross | downtrend / none |
| SMA20 / SMA50 | 561.87 / 574.63 |
| RSI (14) / Stochastic %K | 40.2 / 9.5 |
| Bollinger %B / ATR | 20% / 23.02 |
| Support / Resistance 20 days | 536.50 / 586.30 |
| Data as of | 29 October 2026 00:01 WIB |
Disclaimer: This technical analysis is generated automatically from exchange data (via Yahoo Finance) and indicators calculated by JournalArta, for information and education only. The verdict and the entry, target and stop-loss levels are not investment advice or a solicitation to buy or sell any security. Investment decisions and their risks rest solely with the reader.
Track Glencore share price daily: live levels, support/resistance and our full Glencore analysis history.