GSK Momentum Gains: Stock Drops 4.78% (October 28, 2026)
On October 28, 2026: price 1,831.50 GBp, trend sideways, RSI 46.9, support 1,735.50, resistance 1,923.50. technical analysis of gsk stock.
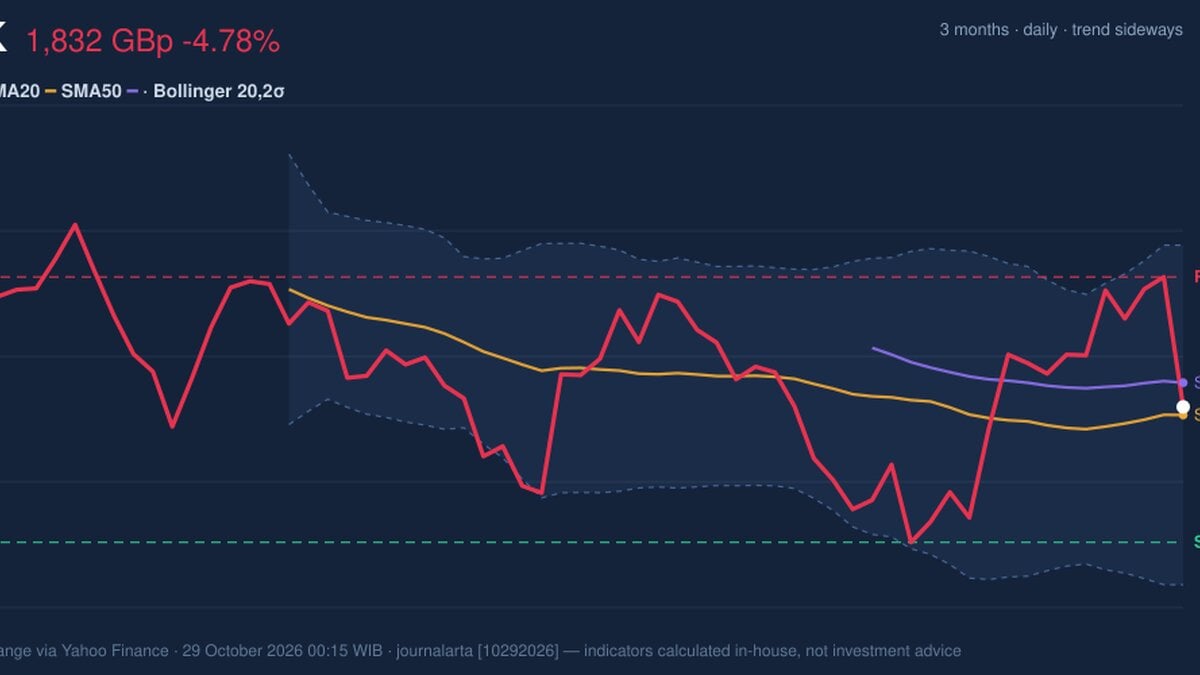
GSK plc shares fell 4.78% on Wednesday, October 28, 2026, closing at 1,831.50 pence (GBp) on the London Stock Exchange, down from a previous close of 1,923.50, according to exchange data via Yahoo Finance. Two signals put the stock on the watchlist: the one-day drop was about 1.3 times the stock's average daily range, and trading volume ran 2.3 times its 20-day average.
Why GSK is in focus today
- One-day move of -4.78%, about 1.3× its average daily range (ATR)
- Volume at 2.3× the 20-day average
Selected automatically from 16 LSE (UK) stocks by a technical-signal score with daily weighted randomisation — not a recommendation.
The move was sharp. It also left the stock almost exactly where it started the month.
Trend & Price Action
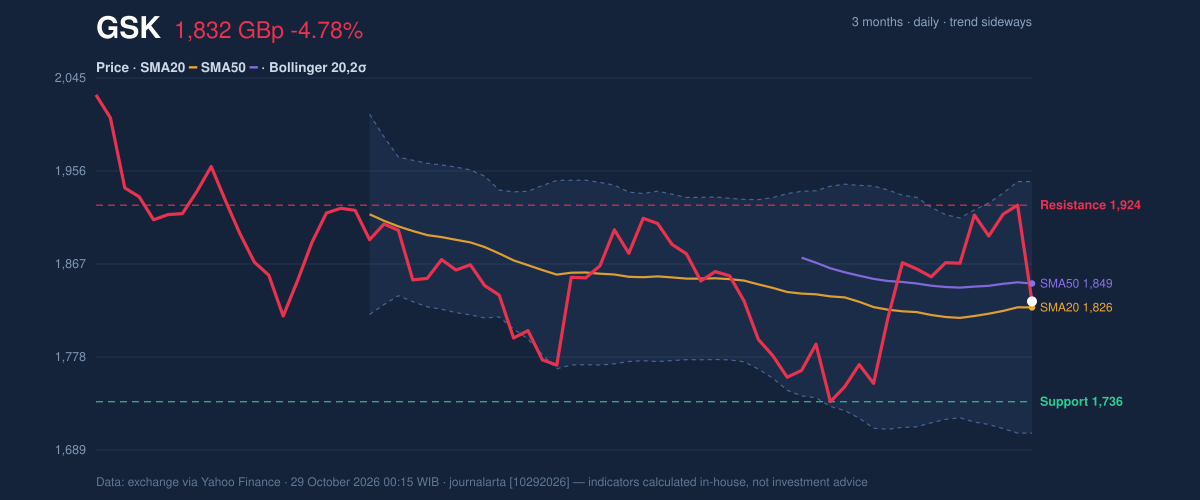
The five-day change is -1.95% and the one-month change is -0.03%, so the one-session slide has erased most of the recent gains but not pushed the stock into a new downtrend. The trend reads sideways: the 20-day average rose 0.56% over five days, a gentle tilt rather than a directional push. The price sits above the 20-day moving average (SMA20) at 1,825.78 but below the 50-day (SMA50) at 1,848.63. A moving average is simply the average closing price over a set number of days, and a price wedged between the two suggests neither buyers nor sellers hold control. Data shows no new MA-cross, meaning the two averages have not recently swapped places.
The drop also reversed a test of the top of the range. The previous close of 1,923.50 is precisely the 20-day resistance, so the stock was rejected at the ceiling. As shown in the chart, price now sits at roughly 51% of its 20-day range, with the three-month high at 2,158.00 well overhead and the three-month low at 1,735.50 coinciding with 20-day support.
Oscillators & Momentum
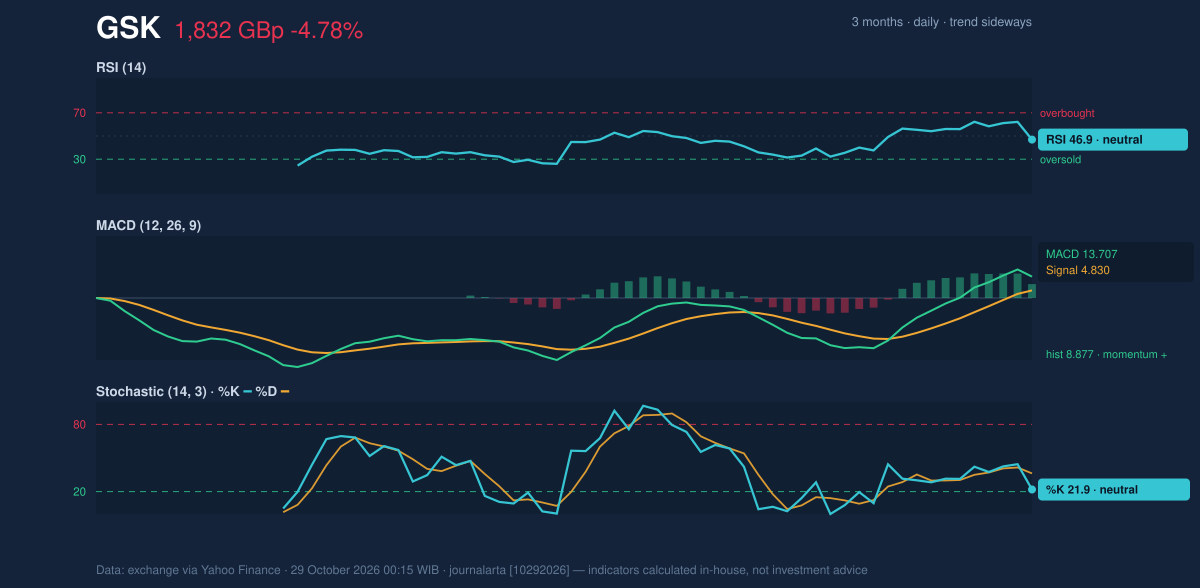
Momentum gauges send mixed messages. The Relative Strength Index (RSI), which measures how strongly prices have risen versus fallen over 14 days, stands at 46.9, neutral. The Stochastic oscillator, which shows where the close sits within recent highs and lows, reads %K 21.9 and %D 36.3. That is still classed neutral, but %K is close to the zone traders associate with oversold conditions, below 20, after the sell-off.
The MACD, which compares short and long-term averages to gauge momentum, remains positive: 13.707 against a signal line of 4.830, a histogram of 8.877. That reflects the earlier climb and has not yet rolled over. Because the MACD reacts with a lag, one heavy down day may not appear in it for several sessions. The gap between a positive MACD and a weak Stochastic is the key tension here.
Volatility & Volume
Volume was 16,828,085 shares, 2.3 times the 20-day average of 7,476,409. A drop on heavy volume suggests real selling pressure rather than thin-market drift, and the On-Balance Volume (OBV) indicator, which tallies volume flowing in and out, is falling, in line with that reading.
Bollinger Bands, which draw a channel two standard deviations around the 20-day average, span 1,705.50 to 1,946.05, a width of 13.2%, classed as normal. The %B reading of 52% places the close mid-channel, so the fall has not stretched price outside the bands. The Average True Range (ATR), a measure of typical daily movement, is 65.27, or 3.6% of the price, flagged as high volatility. Wide daily swings are therefore normal for this stock at present.
Key Levels & Scenarios
The nearest floor is support at 1,735.50, which also marks the three-month low, with the lower Bollinger Band at 1,705.50 just below. A close under that zone would put the stock in fresh three-month-low territory. On the upside, the SMA50 at 1,848.63 is the first hurdle, then the 1,923.50 resistance that capped the previous session and the upper band at 1,946.05. Holding above the SMA20 at 1,825.78 would keep the range-bound picture intact; slipping beneath it would leave the middle band as resistance.
Technical Verdict: HOLD (wait & see)
HOLD (wait & see) is the reading that fits the indicators.
- The trend is sideways, with price between the SMA20 and SMA50 and no MA-cross.
- RSI at 46.9 is neutral, while a positive MACD conflicts with a falling OBV and a Stochastic %K near 22.
- Heavy volume on the decline raises the odds of follow-through, but price sits mid-Bollinger channel.
- Ideal entry range: 1,735.50 to 1,825.78, from support up to the SMA20.
- Exit target: 1,923.50, the 20-day resistance.
- Stop loss: below 1,705.50, the lower Bollinger Band.
The verdict is invalidated if price closes below 1,735.50 support, or if it reclaims 1,923.50 on strong volume.
In plain terms: after a sharp, heavily traded drop, the chart shows no clear direction yet, so waiting for the next move to declare itself fits the data better than acting now. This is technical analysis, not an investment recommendation.
| Indicator | Value |
|---|---|
| Last price | 1,831.50 GBp |
| Change (1 day / 5 days / 1 month) | -4.78% / -1.95% / -0.03% |
| SMA20 / SMA50 | 1,825.78 / 1,848.63 |
| Bollinger (upper / middle / lower) | 1,946.05 / 1,825.78 / 1,705.50 |
| RSI(14) | 46.9 |
| Stochastic %K / %D | 21.9 / 36.3 |
| MACD / signal / histogram | 13.707 / 4.830 / 8.877 |
| ATR(14) | 65.27 (3.6%) |
| Volume vs 20-day average | 16,828,085 vs 7,476,409 (2.3×) |
| Support / Resistance (20 days) | 1,735.50 / 1,923.50 |
| 3-month high / low | 2,158.00 / 1,735.50 |
Summary Data GSK
| Last price | 1,831.50 GBp |
| Change 1 day / 5 days / 1 month | -4.78% / -1.95% / -0.03% |
| Trend / MA-cross | sideways / none |
| SMA20 / SMA50 | 1,825.78 / 1,848.63 |
| RSI (14) / Stochastic %K | 46.9 / 21.9 |
| Bollinger %B / ATR | 52% / 65.27 |
| Support / Resistance 20 days | 1,735.50 / 1,923.50 |
| Data as of | 29 October 2026 00:15 WIB |
Disclaimer: This technical analysis is generated automatically from exchange data (via Yahoo Finance) and indicators calculated by JournalArta, for information and education only. The verdict and the entry, target and stop-loss levels are not investment advice or a solicitation to buy or sell any security. Investment decisions and their risks rest solely with the reader.
Track GSK share price daily: live levels, support/resistance and our full GSK analysis history.