RELX Stock Analysis: Drops 1.63%, Momentum Gains
On October 28, 2026: price 2,891.00 GBp, trend uptrend, RSI 60.1, support 2,510.00, resistance 3,039.00. technical analysis of relx stock.
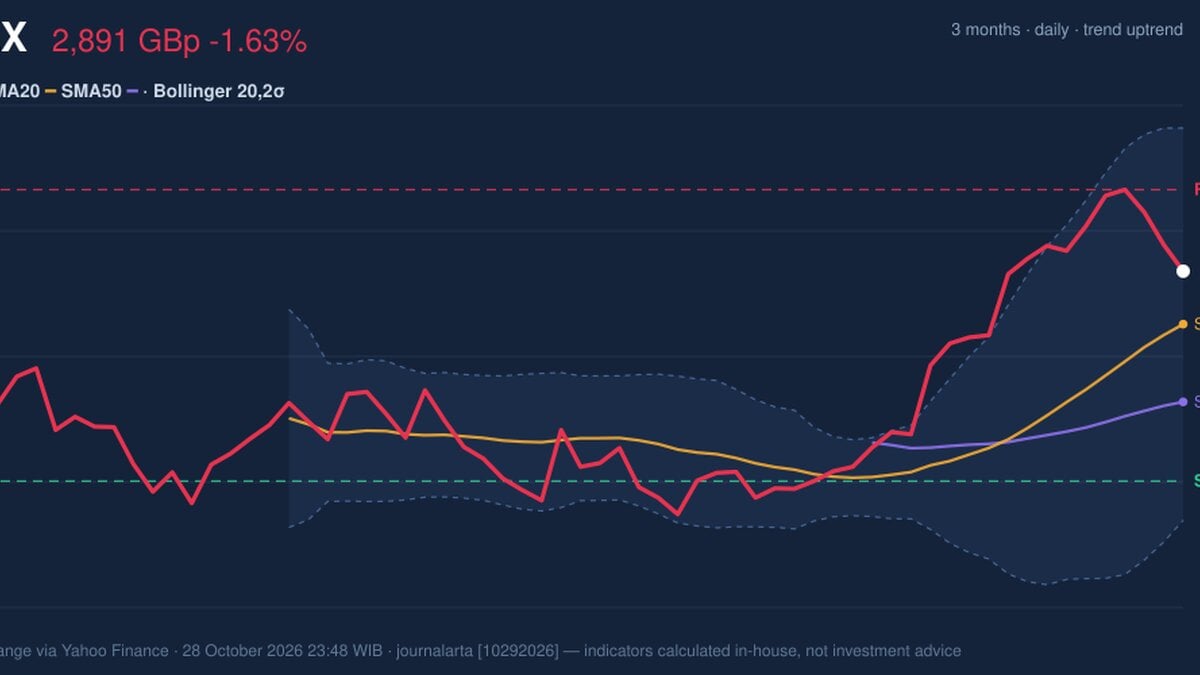
London-listed RELX plc slipped 1.63% on Wednesday, October 28, 2026, to close at 2,891.00 pence (GBp) on the London Stock Exchange, down from a previous close of 2,939.00. It was a pause, not a break. The stock is still up 15.83% over one month, and the 5-day change of -2.76% sits against a much stronger backdrop.
Trend & Price Action
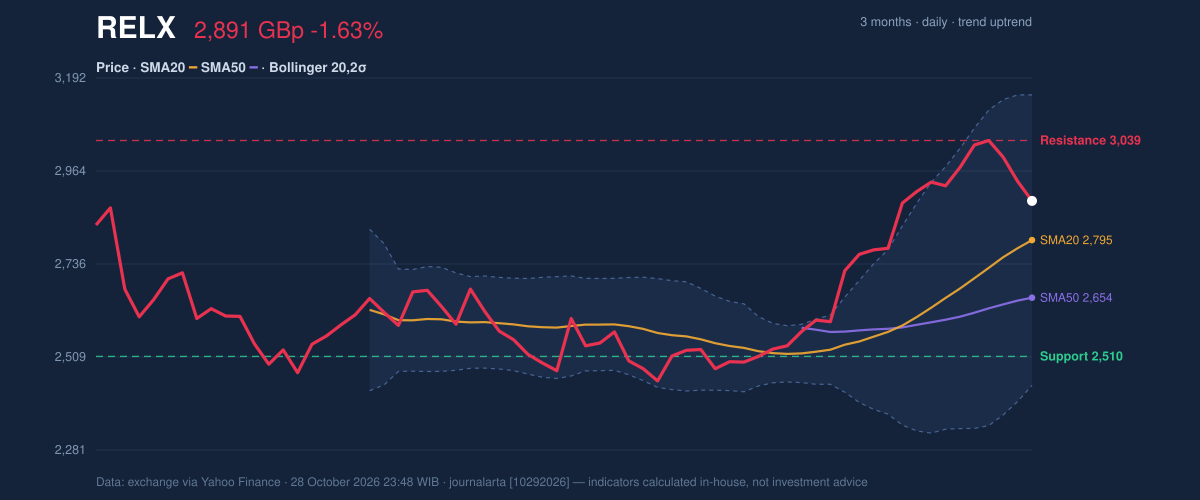
The structure remains that of an uptrend. The price sits above the 20-day average of 2,794.90, which in turn is well above the 50-day average of 2,653.86. The 20-day average rose 4.43% over five days, a steep slope that shows how quickly recent prices have pulled the average upward. No new moving-average crossover has formed. In plain terms, the shorter average already leads the longer one, so there is no fresh signal, only a continuing condition.
The stock trades at 72% of its 20-day range, between support at 2,510.00 and resistance at 3,039.00. The three-month high and low are 3,053.00 and 2,418.00, so the price is in the upper part of a wide band, though not at the extreme. As shown in the chart below, the retreat has so far stayed well clear of the 20-day average.
[GRAFIK-PRICE-PLACEHOLDER]Oscillators & Momentum
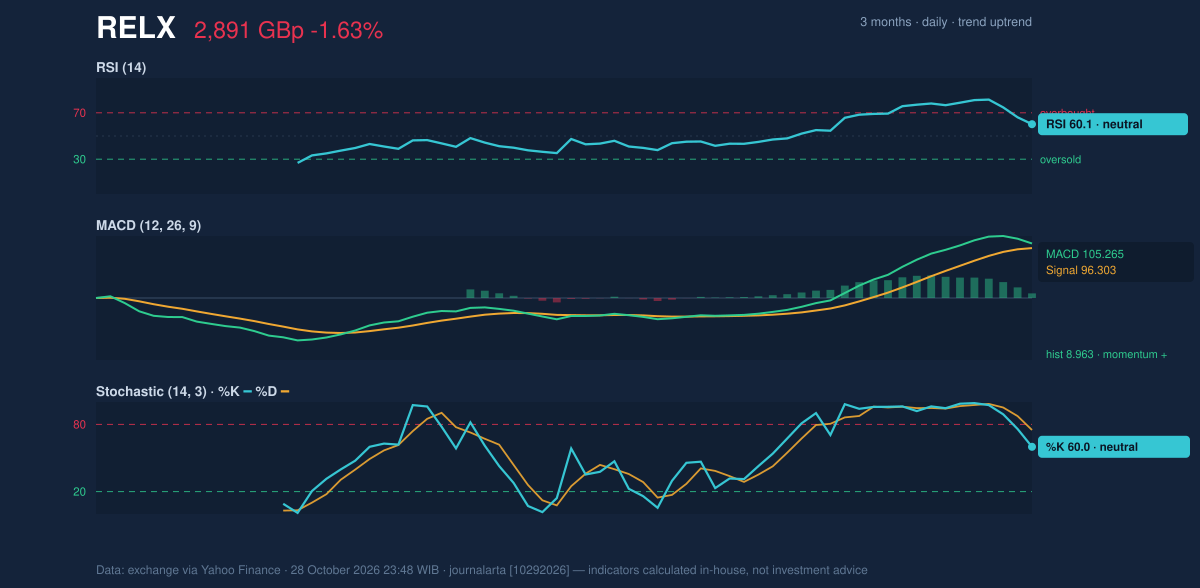
Momentum indicators are cooling rather than reversing. The Relative Strength Index (RSI), which gauges the speed of recent gains and losses on a 0-100 scale, reads 60.1, neutral. Readings above 70 are usually viewed as stretched, so there is room before that threshold. The Stochastic oscillator, which compares the close with the recent trading range, shows %K at 60.0 below %D at 75.0. That ordering suggests short-term momentum has turned down within a neutral zone.
The MACD, a trend-following gauge built from two moving averages, remains constructive: the line at 105.265 is above its signal line at 96.303, leaving a histogram of 8.963, which points to positive momentum. The mix is typical of a pullback inside a rising trend: slower indicators still support the move, faster ones are easing.
Volatility & Volume
Bollinger Bands, which draw a channel two standard deviations around the 20-day average, are wide at 25.5% of the middle line and expanding, a sign of high volatility. The %B reading of 64% places the price in the upper half of the channel, between the middle band at 2,794.90 and the upper band at 3,150.70. The lower band is at 2,439.10. The Average True Range (ATR), a measure of typical daily movement, is 76.48 pence, or 2.6% of the price, which is moderate. A daily swing of that size is enough to test nearby levels quickly.
Participation was thin on the decline. Volume of 2,916,288 shares was 0.7 times the 20-day average of 4,253,175, so the drop did not come with heavy selling. On-balance volume (OBV), which adds volume on up days and subtracts it on down days, is rising, which supports the view that buyers have been more active over the period.
Key Levels & Scenarios
If the price recovers, the first hurdle is resistance at 3,039.00, followed by the three-month high of 3,053.00. If weakness extends, the 20-day average at 2,794.90 is the first area to watch, then support at 2,510.00. A close below the 50-day average at 2,653.86 would challenge the steepness of the current trend.
Technical Verdict: HOLD (wait & see)
HOLD (wait & see) is the reading the indicators support, for these reasons:
- The trend is positive: price above the 20-day and 50-day averages, and MACD above its signal line.
- Short-term momentum is fading: Stochastic %K (60.0) is below %D (75.0) and the price fell 1.63% in the session.
- Volume at 0.7 times normal means the pullback lacks conviction in either direction.
Reference levels from the data, for educational purposes:
- Entry range: 2,794.90 (20-day average) to 2,653.86 (50-day average)
- Exit target: 3,039.00 (20-day resistance), then 3,053.00 (three-month high)
- Stop loss: below 2,510.00 (20-day support)
The verdict is invalidated if price falls below 2,510.00. In plain terms: the trend is still up, but the stock has stalled, so the data favor waiting for a clearer move.
This is technical analysis, not an investment recommendation.
| Indicator | Value |
|---|---|
| Last price | 2,891.00 GBp |
| Change (1 day / 5 days / 1 month) | -1.63% / -2.76% / 15.83% |
| SMA20 / SMA50 | 2,794.90 / 2,653.86 |
| Bollinger (upper / middle / lower) | 3,150.70 / 2,794.90 / 2,439.10 |
| RSI(14) | 60.1 |
| Stochastic %K / %D | 60.0 / 75.0 |
| MACD / signal / histogram | 105.265 / 96.303 / 8.963 |
| ATR(14) | 76.48 |
| Support / resistance (20 days) | 2,510.00 / 3,039.00 |
| 3-month high / low | 3,053.00 / 2,418.00 |
Volume in the October 28 session was 2,916,288 shares, against a 20-day average of 4,253,175.
Summary Data RELX
| Last price | 2,891.00 GBp |
| Change 1 day / 5 days / 1 month | -1.63% / -2.76% / 15.83% |
| Trend / MA-cross | uptrend / none |
| SMA20 / SMA50 | 2,794.90 / 2,653.86 |
| RSI (14) / Stochastic %K | 60.1 / 60.0 |
| Bollinger %B / ATR | 64% / 76.48 |
| Support / Resistance 20 days | 2,510.00 / 3,039.00 |
| Data as of | 28 October 2026 23:48 WIB |
Disclaimer: This technical analysis is generated automatically from exchange data (via Yahoo Finance) and indicators calculated by JournalArta, for information and education only. The verdict and the entry, target and stop-loss levels are not investment advice or a solicitation to buy or sell any security. Investment decisions and their risks rest solely with the reader.
Track RELX share price daily: live levels, support/resistance and our full RELX analysis history.