CRM Stock Gains 1.94% Today, Momentum Weakens
On September 14, 2026: price 247.72 USD, trend uptrend, RSI 64.9, support 190.97, resistance 264.43. technical analysis of crm stock. CRM Stock Gains — full…

Salesforce (CRM) rose to 247.72 USD on the NYSE, up from 243.00 at the previous close, but the move sits inside a more complicated technical picture: the shares are still in an uptrend, yet momentum has cooled and trading activity has thinned. The stock is holding above its short- and medium-term moving averages, which keeps the broader structure constructive, but the chart now shows a market that is advancing with less force than the price alone suggests.
Trend & Price Action
The first signal is the trend itself. Salesforce is trading above both SMA20 at 230.63 and SMA50 at 198.61, which tells readers the stock remains above its recent and intermediate cost bases. In plain terms, buyers who entered over the past month or two are still, on average, in profit, and that usually helps prevent sharp breakdowns unless sentiment shifts quickly.
The slope of the SMA20, at 5.99% over 5 days, confirms the short-term trend is still rising. But the price is not pressing the upper edge of the range with conviction. At 77% of the 20-hour range, CRM is closer to resistance than support, and that matters because stocks often struggle when they are elevated in the range without strong participation behind the move.
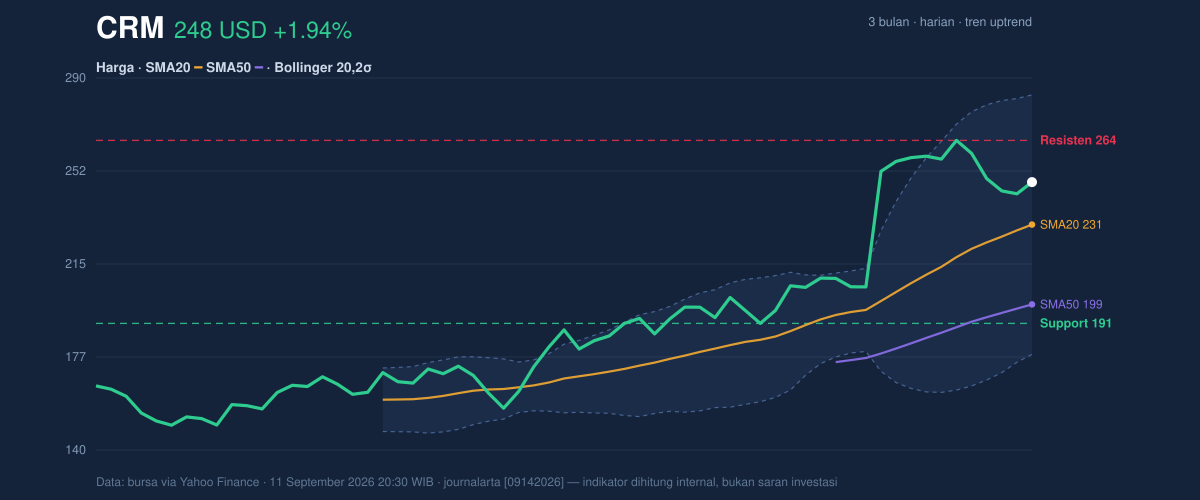
The chart also shows a wide band structure. The Bollinger upper band at 282.71 is still well above the current price, while the middle band sits at 230.63. That means the stock has already moved above its short-term average, but it has not yet tested the extreme upper boundary that often marks stretched conditions. The lack of a new MA-cross suggests the trend is not being reinforced by a fresh moving-average signal; it is continuing on existing structure rather than a new technical acceleration.
Oscillators & Momentum
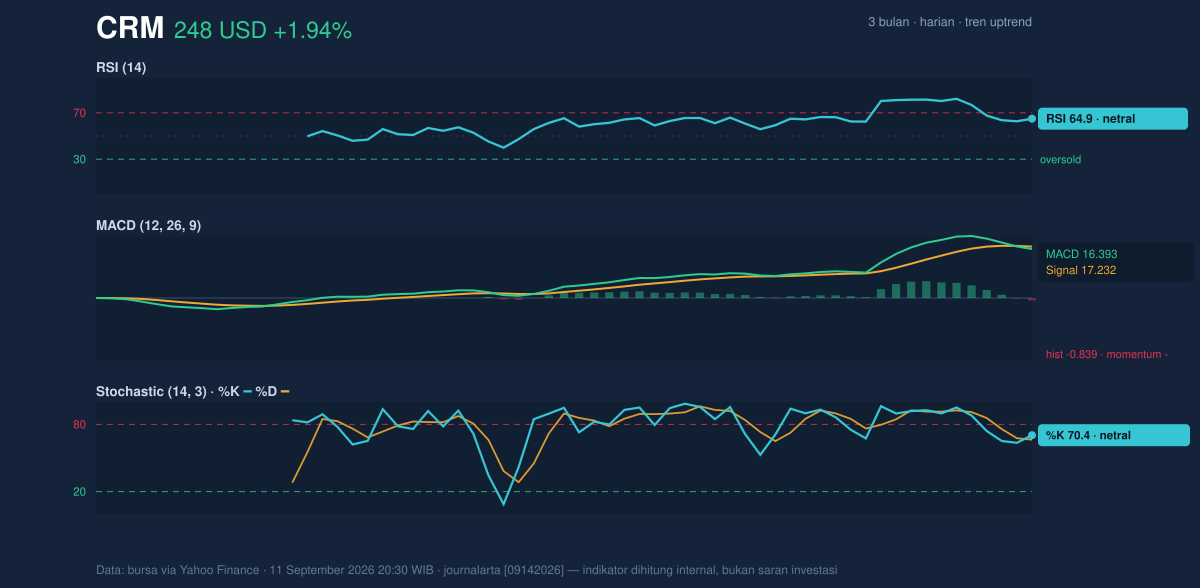
Momentum is where the picture becomes more cautious. The RSI(14) at 64.9 is still neutral by the data provided, but it is close enough to the upper end of the scale to show the stock is no longer early in its advance. RSI in this zone usually means the market has already done a fair amount of work, though it is not yet at the level that would imply a fully overextended move.
The Stochastic %K at 70.4 and %D at 66.4 are also neutral, but they sit in the upper half of the range. That typically signals momentum is positive without being explosive. In other words, the stock is not oversold and waiting for a rebound; it is already extended enough that fresh upside needs continued confirmation.
The more important detail is the MACD at 16.393 versus the signal line at 17.232, with a histogram of -0.839. That negative histogram means the trend’s internal momentum has slipped below its signal line. For general readers, this is often a warning that price can keep rising for a while, but the pace of the move is losing energy. It is a divergence to watch, especially when volume is weak.
Volatility & Volume
Volatility is elevated. The Bollinger band width of 45.2% shows the bands are expanding, which usually means the market expects larger swings ahead. This is reinforced by the ATR(14) at 11.93, or 4.8% of price, which is a clear sign of a stock that can move sharply in either direction in a single session. Expanding bands with high ATR do not tell you direction on their own; they tell you that directional moves, once they start, can travel quickly.
Volume, however, is not confirming enthusiasm. Last session volume was 9,738,300, well below the 20-hour average of 16,486,390, or about 0.6×. That matters because rising prices on light volume often suggest the move is not broadly sponsored. It can still continue, but the market is more vulnerable to sudden reversals if buyers step back.
The one constructive counterpoint is that OBV is rising. On-balance volume tracks whether volume flow is generally supporting the trend. A rising OBV says accumulation has not disappeared, even if the latest session was quiet. So the stock is not showing a clean bearish breakdown; it is showing a trend that is still intact but less forceful than the chart’s price action alone might imply.
Key Levels & Scenarios
The nearest technical map is fairly clear. Support at 190.97 is the key floor from the 20-hour range, while resistance at 264.43 is the next major ceiling. With the stock currently trading in the upper part of that range, the market is effectively testing whether it can hold above the middle zone and eventually challenge the resistance band.
The three-month range gives additional context. The stock’s 3-month high is 268.27 and the 3-month low is 146.32. That places the current price much closer to the top of the recent range than the bottom, which is consistent with an established advance. But proximity to the high also means upside progress may become more selective unless momentum improves.
If CRM can push through 264.43 with stronger participation, the chart would start to look like a continuation move rather than a stalled rally. If it fails to hold above the middle of the Bollinger structure and slips back toward 230.63, the market would be telling us that the recent advance is losing traction. A break below 190.97 would be a more serious technical setback because it would undermine the near-term support zone that has helped contain the trend.
Technical Verdict: HOLD (wait & see)
HOLD (wait & see)
- RSI at 64.9 and Stochastic at 70.4/66.4 show the stock is still constructive, but not early enough in the move to signal fresh momentum.
- MACD histogram at -0.839 shows momentum is fading even as price remains above SMA20 at 230.63 and SMA50 at 198.61.
- Volume at 0.6× the 20-hour average means the latest rise is not yet backed by broad participation, even though OBV is rising.
- Verdict invalidated if price breaks below 190.97.
- Ideal Entry Range: 230.63 to 247.72
- Exit Target: 264.43
- Stop Loss protection: 190.97
In plain English: the stock is still technically healthy, but the next move needs stronger proof before the chart fully earns confidence.
The upper Bollinger band is 282.71.
Summary Data CRM
| Last price | 247.72 USD |
| Change 1 day / 5 days / 1 month | 1.94% / -6.32% / 23.02% |
| Trend / MA-cross | uptrend / none |
| SMA20 / SMA50 | 230.63 / 198.61 |
| RSI (14) / Stochastic %K | 64.9 / 70.4 |
| Bollinger %B / ATR | 66% / 11.93 |
| Support / Resistance 20 days | 190.97 / 264.43 |
| Data as of | 11 September 2026 20:30 WIB |



