CSCO Stock Gains 4.37%, Testing Key Resistance In Focus
On September 14, 2026: price 112.13 USD, trend sideways, RSI 50.6, support 107.44, resistance 112.90. technical analysis of csco stock.

Cisco Systems advanced to 112.13 USD after a 4.37% one-day rise, according to data from NASDAQ via Yahoo Finance, but the move sits inside a broader pause rather than a clean trend break. The stock is still classified as sideways, and that matters: the latest bounce has lifted price back above the short-term average, yet it has not fully repaired the weakness implied by a falling 20-day slope and a 50-day average still overhead. In plain terms, buyers have regained some control, but not enough to declare the tape decisively stronger.
Trend & Price Action
As shown in the chart, Cisco is trading above SMA20 at 110.44 but below SMA50 at 113.73, a configuration that usually signals a market caught between short-term stabilization and medium-term resistance. That gap is important because the 20-day average is acting as a near-term floor while the 50-day average is still capping progress. The absence of a fresh MA-cross means there is no new moving-average confirmation to suggest a trend reversal has already taken hold.
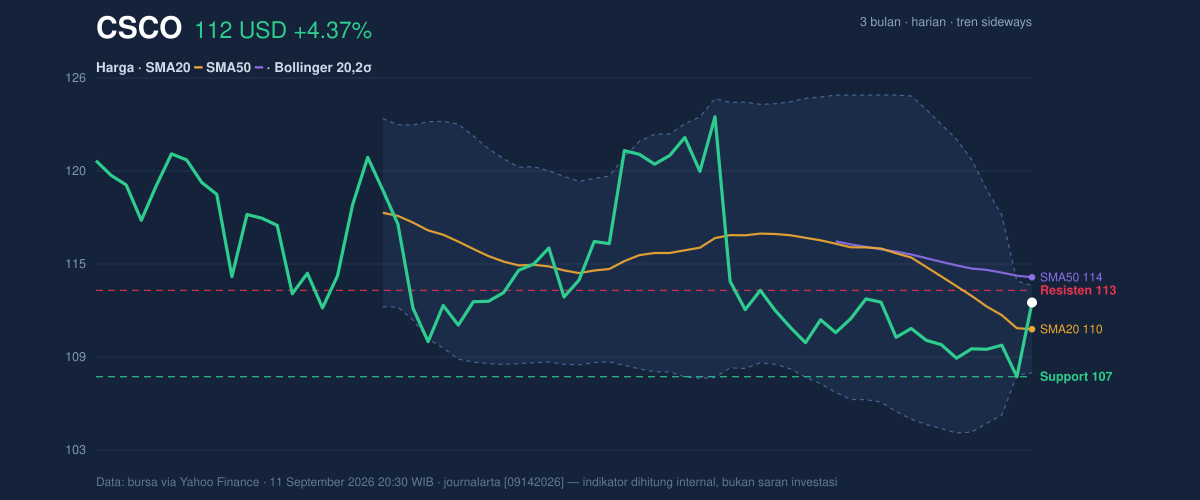
The price is also sitting near the upper part of its recent range, at 86% of the 20-hour range, with 20-hour support at 107.44 and 20-hour resistance at 112.90. That positioning usually reflects improved sentiment, but it can also leave the stock vulnerable to profit-taking if momentum stalls just below resistance. The broader three-month range reinforces that point: Cisco is still well below the 3-month high of 124.71, yet comfortably above the 3-month low of 107.36. The message is not breakout, but recovery from the lower half of the range.
The Bollinger Band setup adds another layer. Price is moving near the upper band at 113.21, with %B at 81%, which means the stock is trading closer to the top of its volatility envelope than the middle. That usually indicates strength, but not necessarily durability. More importantly, the band width is only 5.0%, a squeeze that often precedes a larger move. In practical terms, Cisco is compressing after a period of hesitation, so the next decisive break may matter more than the current intraday lift.
Oscillators & Momentum
The momentum picture is mixed rather than cleanly bullish. RSI at 50.6 is essentially neutral, which tells investors the stock is neither overextended nor oversold. That neutrality matters because it leaves room for movement in either direction without immediate technical exhaustion. By contrast, the stochastic oscillator is flashing a more stretched condition, with %K at 85.3 and %D at 40.3. That spread typically shows short-term price speed has outrun its own average, often a sign that a rally is getting ahead of itself.
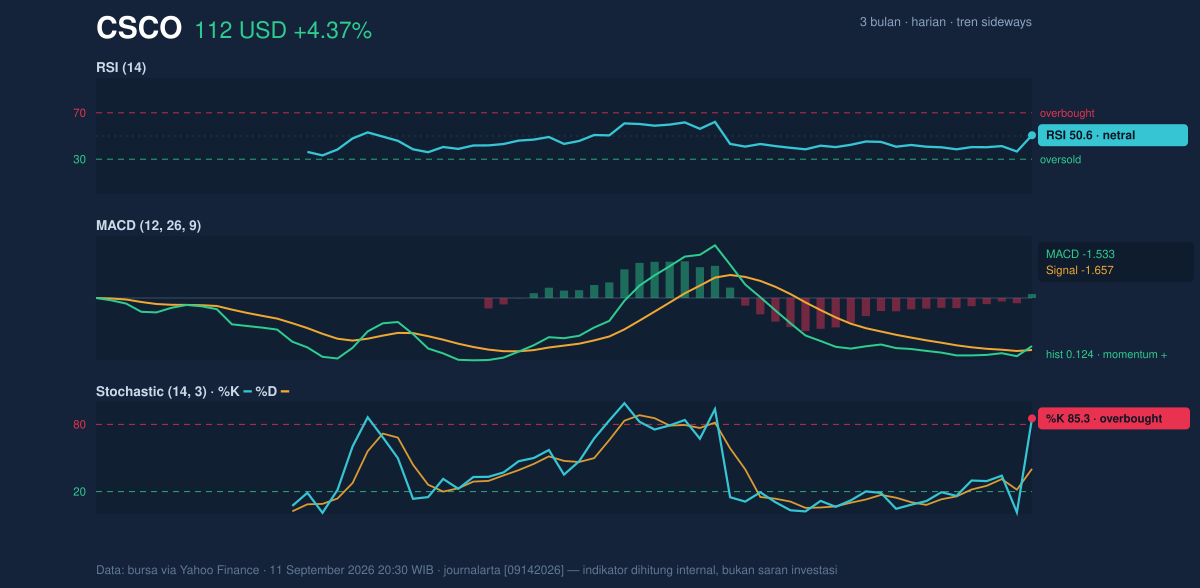
The MACD is the more constructive signal in the set. MACD at -1.533 remains below zero, so the broader momentum backdrop is not fully positive, but the line is above its signal at -1.657 and the histogram at 0.124 is positive. That combination means downside momentum is easing and the shorter-term rhythm has improved. In other words, the stock is not in a confirmed uptrend, but its internal momentum has turned less negative. That can support further gains if price can clear nearby resistance; without that follow-through, the oscillator setup risks fading back into range trading.
Volatility & Volume
Volatility is moderate, with ATR(14) at 2.08, or about 1.9% of price. That is enough for normal daily swings, but not a signal of disorderly trading. Combined with the narrow Bollinger squeeze, it suggests Cisco may be coiling rather than trending aggressively. The market is not showing panic or euphoria; it is showing compression.
Volume, however, is not fully confirming the price bounce. Last trade volume was 14,156,800, below the 20-hour average of 15,343,480, or 0.9× normal. That means the latest advance happened without stronger-than-usual participation. The OBV is down, which is a cautionary sign because on-balance volume tracks whether money flow is supporting price. When price rises but OBV falls, the move can be less durable than it looks on the chart. This is especially relevant here because the stock is pressing into resistance with only average-to-soft participation behind it.
Key Levels & Scenarios
The immediate technical map is clear. Support at 107.44 is the first line to watch, and it sits very close to the 3-month low of 107.36, making that zone especially important. If that floor holds, Cisco can continue to test the upper band and the 112.90 resistance. If it breaks above 112.90 with better participation, the next technical hurdle is the 113.21 Bollinger upper band, followed by the SMA50 at 113.73. That cluster is the real test of whether this bounce is becoming something more durable.
If the stock fails to hold 107.44, the chart would lose its near-term recovery structure, and the squeeze would likely resolve in a weaker direction. Because the band width is narrow, the market may be waiting for exactly that kind of trigger before choosing a side.
Technical Verdict: HOLD (wait & see)
HOLD (wait & see) fits the current setup because the chart is improved but not yet confirmed.
- RSI at 50.6 is neutral, so there is no strong momentum edge.
- MACD is positive versus its signal, but still below zero, which points to improving but incomplete momentum.
- Price is above SMA20 yet below SMA50, so the stock remains trapped between short-term support and medium-term resistance.
- Verdict invalidated if price falls below 107.44, because that would break the nearest support and weaken the recovery structure.
- Ideal Entry Range: 107.68 to 110.44
- Exit Target: 112.90 to 113.73
- Stop Loss protection: below 107.44
For non-traders, this means Cisco looks steadier than it did earlier, but the chart still needs proof before the move can be treated as more than a rebound.
The latest 3-month high remains 124.71.
Summary Data CSCO
| Last price | 112.13 USD |
| Change 1 day / 5 days / 1 month | 4.37% / 3.24% / -1.18% |
| Trend / MA-cross | sideways / none |
| SMA20 / SMA50 | 110.44 / 113.73 |
| RSI (14) / Stochastic %K | 50.6 / 85.3 |
| Bollinger %B / ATR | 81% / 2.08 |
| Support / Resistance 20 days | 107.44 / 112.90 |
| Data as of | 11 September 2026 20:30 WIB |



