DBS Stock Technicals Today: Gains 0.27%, Momentum Weakens
On September 14, 2026: price 77.00 SGD, trend uptrend, RSI 55.5, support 75.56, resistance 78.65. technical analysis of dbs stock. DBS Stock Technicals — full…

DBS Group Holdings closed at SGD 77.00, up 0.27% from the previous close of 76.79, but the more important signal is not the day’s gain: it is where the share sits inside a tightening range. As shown in the chart, DBS is still trading above its short- and medium-term trend markers, yet momentum has softened enough to keep the move from looking decisive. That combination often matters more than the headline price change because it tells investors whether a rise is being powered by conviction or merely drifting higher on limited participation.
Trend & Price Action
The stock remains in an uptrend, with the SMA20 at 76.84 rising at 0.44% over 5 days, and DBS is holding above the SMA20 as well as well above the SMA50 at 74.50. That positioning matters because it shows the shorter trend still leads the longer one, a classic sign that the broader structure has not broken down. There is also no fresh MA-cross, which means the chart is not flashing a new trend reversal signal; instead, it is showing a mature advance that now needs follow-through. The share is trading in the middle of its recent band, at 47% of the 20-hour range, with the 3-month high at 79.05 still in view and the 3-month low at 61.60 far below. That placement suggests DBS is neither stretched at the top nor washed out at the bottom.
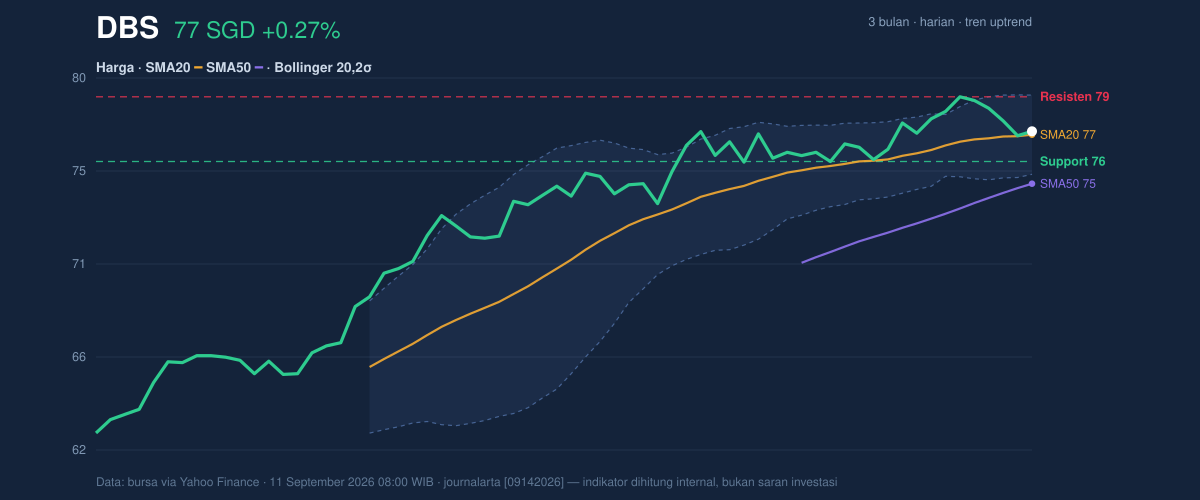
The immediate reading is simple: the trend is intact, but the stock is pausing.
Oscillators & Momentum
Momentum indicators are less enthusiastic than the price trend. The RSI(14) at 55.5 is neutral, which usually means the stock is not overbought and still has room to move, but it is also not showing strong urgency. The Stochastic %K at 48.5 and %D at 50.9 are also neutral, sitting near the middle of the scale rather than at a breakout-extreme. More telling is the MACD at 0.926 versus the signal line at 1.123, leaving a negative histogram of -0.197. In plain language, that means the trend is still positive on price structure, but near-term momentum has slipped below its own trigger line. This kind of divergence does not automatically mean reversal; it often means the market is losing speed and needs either stronger volume or a clean push through resistance to re-accelerate.
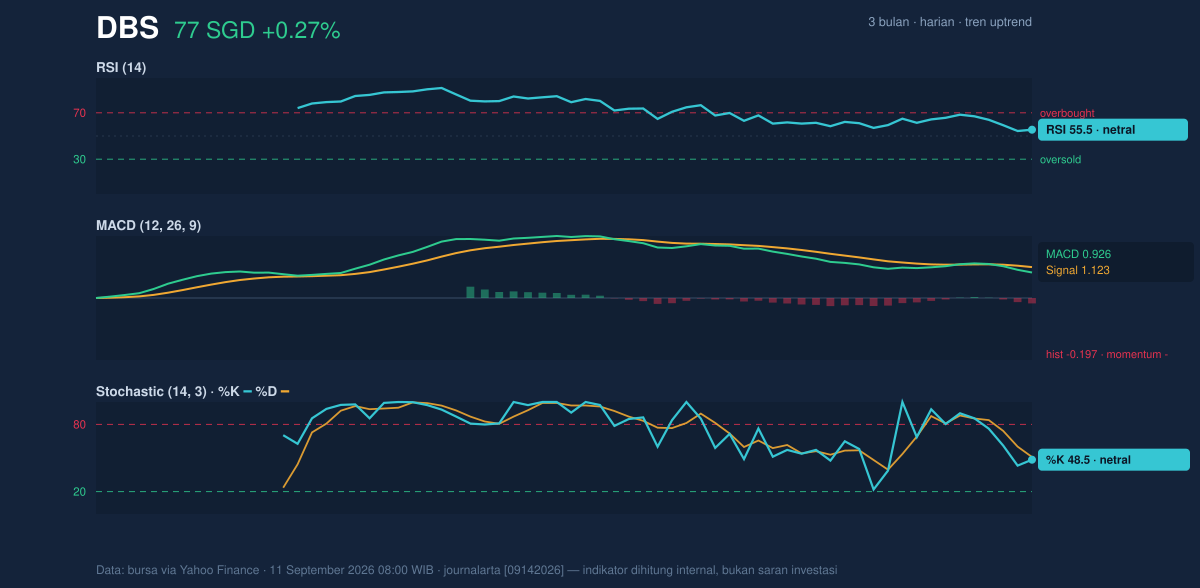
For readers, the message is that the chart is not weak — it is just not yet convincing.
Volatility & Volume
Bollinger Bands are tightening, with the upper band at 78.73, middle band at 76.84, and lower band at 74.95, while band width has narrowed to 4.9%. A squeeze like this often signals that a larger move may be building, but it does not say which direction. When volatility compresses, the market is essentially coiling; the next break tends to be sharper than the recent daily drift. DBS is currently at %B 54%, meaning price sits slightly above the mid-band and is not pressing the upper edge yet. The ATR(14) at 0.88, or 1.1% of price, confirms that daily movement is relatively subdued.
Volume does not yet fully validate the latest rise. Turnover of 3,043,070 is below the 20-day average of 3,471,420, about 0.9x normal, so the move has not been powered by heavy participation. Still, OBV is rising, which is a constructive sign because on-balance volume tracks whether money flow is accumulating even when day-to-day volume is not expanding. That combination — softer volume, rising OBV — often points to steady accumulation rather than a speculative surge.
The chart is coiled, but the crowd is not yet fully committed.
Key Levels & Scenarios
The nearest support at 75.56 sits just below the SMA20 at 76.84 and above the Bollinger lower band at 74.95, creating a relatively tight floor. On the upside, resistance at 78.65 is only slightly below the 3-month high of 79.05 and just under the Bollinger upper band at 78.73, so the stock is approaching a zone where supply may reappear. If DBS clears 78.65, the chart would likely test whether the recent squeeze resolves into a stronger advance. If it fails to hold 75.56, the loss of that support would weaken the current uptrend and shift attention toward the lower band near 74.95.
The key point is that DBS is boxed into a narrow decision area.
Technical Verdict: HOLD (wait & see)
HOLD (wait & see)
- Price trend is still constructive: DBS is above the SMA20 at 76.84 and SMA50 at 74.50, which keeps the broader uptrend intact.
- Momentum is not confirming fully: the MACD histogram at -0.197 shows near-term weakness even as RSI 55.5 and Stochastic 48.5/50.9 stay neutral.
- Volatility is compressed: the Bollinger width at 4.9% and ATR 0.88 suggest a breakout may be forming, but direction is still unproven.
Verdict invalidated if price falls below 75.56.
- Ideal Entry Range: 75.56 to 76.84
- Exit Target: 78.65 to 79.05
- Stop Loss protection: below 74.95
For non-traders: DBS still looks technically solid, but the chart is waiting for a clearer signal before the next move becomes obvious.
“The market is coiling, and the next break will decide whether this is just a pause or the start of something stronger.”
Summary Data DBS
| Last price | 77.00 SGD |
| Change 1 day / 5 days / 1 month | 0.27% / -2.10% / 1.95% |
| Trend / MA-cross | uptrend / none |
| SMA20 / SMA50 | 76.84 / 74.50 |
| RSI (14) / Stochastic %K | 55.5 / 48.5 |
| Bollinger %B / ATR | 54% / 0.88 |
| Support / Resistance 20 days | 75.56 / 78.65 |
| Data as of | 11 September 2026 08:00 WIB |


