HSBC Stock Drops 0.85% Today, Momentum Weakens
On September 14, 2026: price 163.30 HKD, trend uptrend, RSI 52.1, support 160.30, resistance 167.60. technical analysis of hsbc stock. HSBC Stock Drops — full…

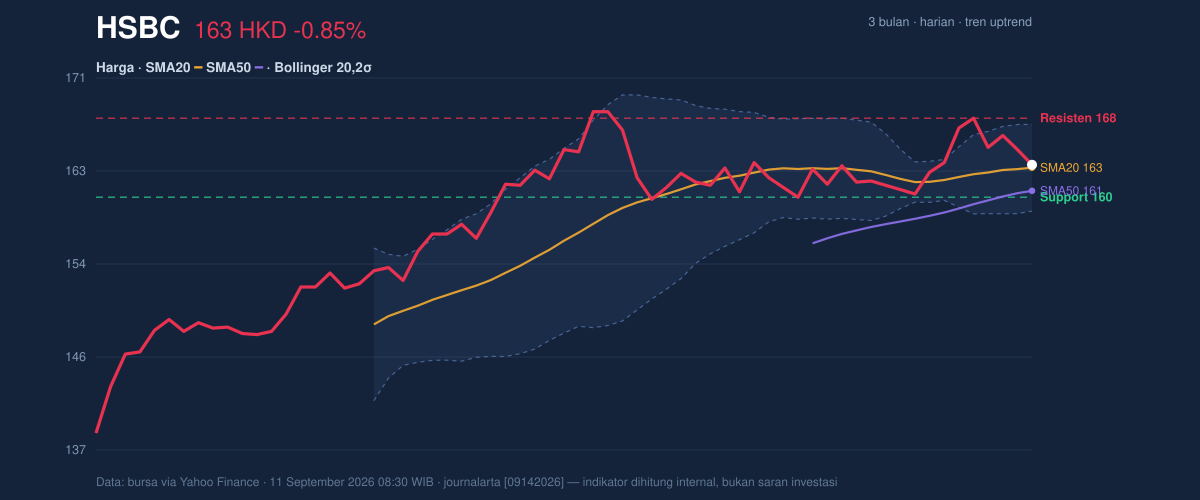
HSBC Holdings closed at HK$163.30, down 0.85% from the previous close of HK$164.70, and the stock is still sitting just above its short-term trend line rather than breaking away from it. That matters because the share price is positioned above the SMA20 at HK$163.03 and above the SMA50 at HK$160.90, which keeps the broader structure in an uptrend even as near-term momentum cools. The message from the tape is not that the trend has failed, but that it has paused.
Trend & Price Action
As shown in the chart, HSBC is trading in the upper half of its recent range, with the price at HK$163.30 sitting around 41% of the 20-hour range between support at HK$160.30 and resistance at HK$167.60. That placement is important: it suggests the market has not lost the higher ground, but it also has not yet forced a clean move through overhead supply. In practical terms, the stock is hovering close to the Bollinger middle band at HK$163.03, which often acts as a pivot between consolidation and directional expansion.
The broader trend still leans constructive. The SMA20 slope of 0.53% over 5 days shows the short-term average is rising, a sign that buyers have remained active enough to prevent a deeper retracement. Yet there is no new MA-cross, so the chart is not flashing a fresh acceleration signal. Instead, it looks like a market that has already made its first move higher and is now deciding whether to build another leg or drift back toward support.
A short pullback inside an uptrend is not the same as a trend reversal.
Oscillators & Momentum
The momentum readings are mixed rather than decisive. RSI at 52.1 is neutral, which means HSBC is neither stretched to the upside nor washed out on the downside. That usually points to balance: buyers and sellers are still engaged, and neither side has enough force to dominate. The Stochastic %K at 49.5 versus %D at 64.5 also sits in neutral territory, but the gap shows short-term momentum has slipped below its signal line, a mild warning that the recent bounce is losing speed.
The more notable signal comes from MACD. With MACD at 1.270 below the signal line at 1.290 and a histogram of -0.021, the momentum overlay is slightly negative. In plain language, the stock is still in an uptrend, but the pace of that advance has slowed enough that the current move is no longer being fully confirmed by momentum. That kind of divergence often appears before either a pause near resistance or a shallow dip back toward the moving averages.
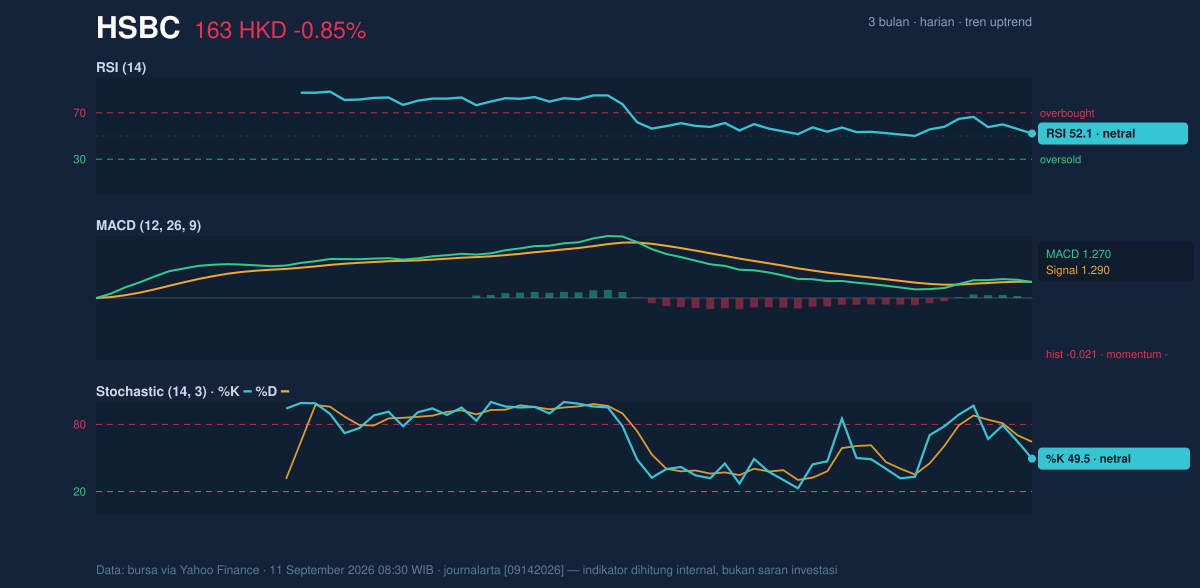
This is not weak enough to call a breakdown, but it is not strong enough to call an acceleration.
Volatility & Volume
Volatility is low. ATR(14) at 2.36, equal to 1.4% of price, indicates the market is not swinging widely from session to session. Low ATR often means the share is compressing before a larger move, especially when paired with a narrowing Bollinger Band. Here, the Bollinger Band width is 4.9% and is described as a squeeze, which is a useful signal: when bands tighten, price often enters a period of coiling before a breakout or breakdown.
The location inside the band is also telling. With %B at 53%, HSBC is slightly above the middle of the Bollinger range, not near the upper edge at HK$167.03 and not pressing the lower band at HK$159.02. That suggests the stock is balanced, waiting for a catalyst rather than already trending hard in either direction.
Volume does not contradict the price action. Last volume was 9,758,966, roughly 1.0x normal versus the 20-session average of 9,986,923. That is important because a real breakout usually needs participation; at the moment, trading activity is ordinary, not emphatic. Still, OBV is rising, which means cumulative volume flow has been improving even if the latest session was not unusually heavy. In effect, the market has not lost underlying accumulation interest.
Key Levels & Scenarios
The chart’s most important reference points are clear. HK$160.30 is the first support to watch, and HK$167.60 is the near-term resistance that has to be cleared before the stock can prove that the squeeze is resolving upward. Beyond that, the 3-month high at HK$169.70 is the next obvious ceiling, while the 3-month low at HK$133.50 remains far below and is not relevant unless the entire structure deteriorates sharply.
If HK$167.60 gives way with follow-through, the chart would shift from consolidation to an attempt at a retest of HK$169.70. If instead the price fails to hold HK$160.30, the current uptrend would lose its short-term footing and the market would likely drift back toward the SMA50 at HK$160.90 and the lower Bollinger band at HK$159.02. Those levels matter because they represent the line between orderly consolidation and a deeper reset.
Technical Verdict: HOLD (wait & see)
HOLD (wait & see)
- RSI 52.1 and Stochastic 49.5/64.5 are neutral, so momentum is not strong enough to justify a directional call.
- MACD 1.270 below signal 1.290 and a -0.021 histogram show mild negative momentum, even though the broader trend is still up.
- Bollinger Bands are squeezing with low ATR at 2.36, which points to compression rather than a confirmed breakout.
- Verdict invalidated if price breaks below HK$160.30, because that would weaken the current short-term structure and challenge the uptrend.
- Ideal Entry Range: HK$160.30 to HK$163.03
- Exit Target: HK$167.60, with HK$169.70 as the next chart reference if resistance is cleared
- Stop Loss protection: below HK$159.02 or, more conservatively, below HK$160.30
For non-traders: HSBC is still holding its uptrend, but the stock is waiting for a stronger signal before the next move is clear.
The latest 20-hour resistance remains HK$167.60.
Summary Data HSBC
| Last price | 163.30 HKD |
| Change 1 day / 5 days / 1 month | -0.85% / -2.04% / 1.55% |
| Trend / MA-cross | uptrend / none |
| SMA20 / SMA50 | 163.03 / 160.90 |
| RSI (14) / Stochastic %K | 52.1 / 49.5 |
| Bollinger %B / ATR | 53% / 2.36 |
| Support / Resistance 20 days | 160.30 / 167.60 |
| Data as of | 11 September 2026 08:30 WIB |



