HSBC Stock Gains 1.54% Today, Momentum Gains
On September 14, 2026: price 1,552.60 GBp, trend uptrend, RSI 54.9, support 1,497.20, resistance 1,580.20. technical analysis of hsbc stock.

HSBC Holdings’ shares on the London Stock Exchange finished at 1,552.60 GBp, up 1.54% on the day, with the stock holding above its short-term trend line and sitting closer to the upper half of its recent trading band, as shown in the chart. The move matters because it keeps HSBC in a constructive technical position even after a weak -1.75% five-day patch: price is still above both the SMA20 at 1,534.96 and the SMA50 at 1,522.94, a sign that buyers have not lost control of the medium-term structure.
Trend & Price Action
The chart shows HSBC trading in an uptrend, with the SMA20 rising 0.46% over 5 days. That slope is important: a rising short-term average usually means recent buying is strong enough to pull the trend line higher, rather than merely bouncing from a one-off dip. The lack of a fresh MA-cross tells us this is not a dramatic trend change; instead, the stock is already in a steady upward phase and is now trying to extend it.
Price is also positioned at about 67% of the 20-hour range, between support at 1,497.20 and resistance at 1,580.20. That placement suggests the market is leaning upward, but not yet in breakout territory. In plain terms, HSBC is closer to the top of its short-term range than the bottom, which usually means the market is willing to pay up, though not aggressively enough to clear resistance decisively yet.
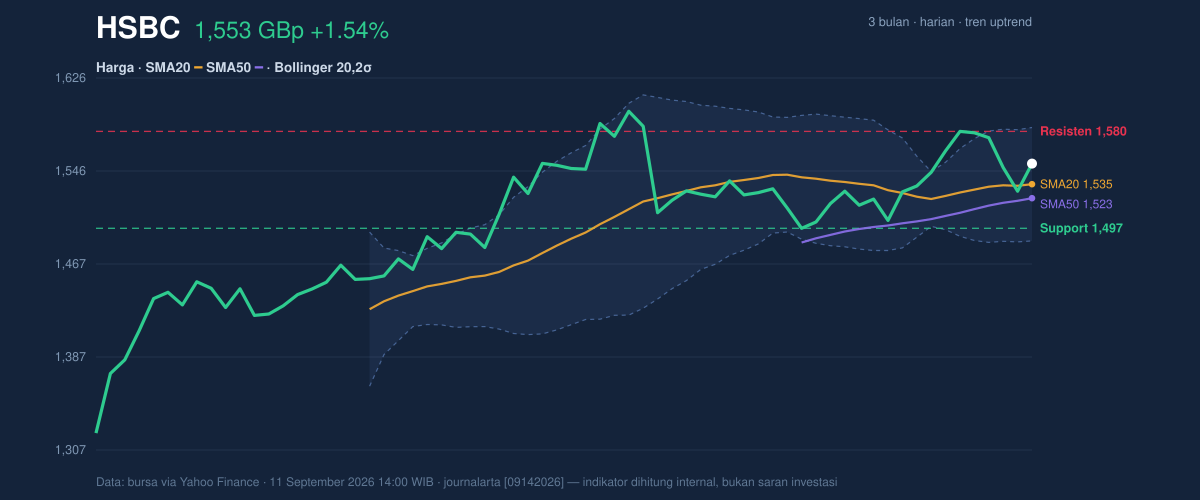
The longer reference point is the 3-month high at 1,610.00 and 3-month low at 1,302.40. HSBC is trading much nearer the upper end of that span, which reinforces the idea that the broader price structure remains healthy. Still, the stock has not fully retested the recent peak, so the market is watching whether it can convert the current move into a fresh push toward that high.
Oscillators & Momentum
Momentum is mixed, but not weak. The RSI(14) at 54.9 is neutral, meaning the share is neither stretched nor washed out. That matters because a neutral RSI gives the stock room to rise without immediately running into overbought conditions. The Stochastic %K at 61.3 and %D at 51.6 is also neutral, but with %K above %D, it hints that recent price action is improving faster than the slower signal line. This is not a strong breakout signal, yet it does show the short-term rhythm is leaning upward.
The most encouraging signal comes from the MACD at 10.762, just above the signal line at 10.742, with a positive histogram of 0.020. The histogram is tiny, but it still matters: it means momentum is positive, even if only marginally. In technical terms, the stock is not accelerating strongly, but it is still pressing upward rather than rolling over.
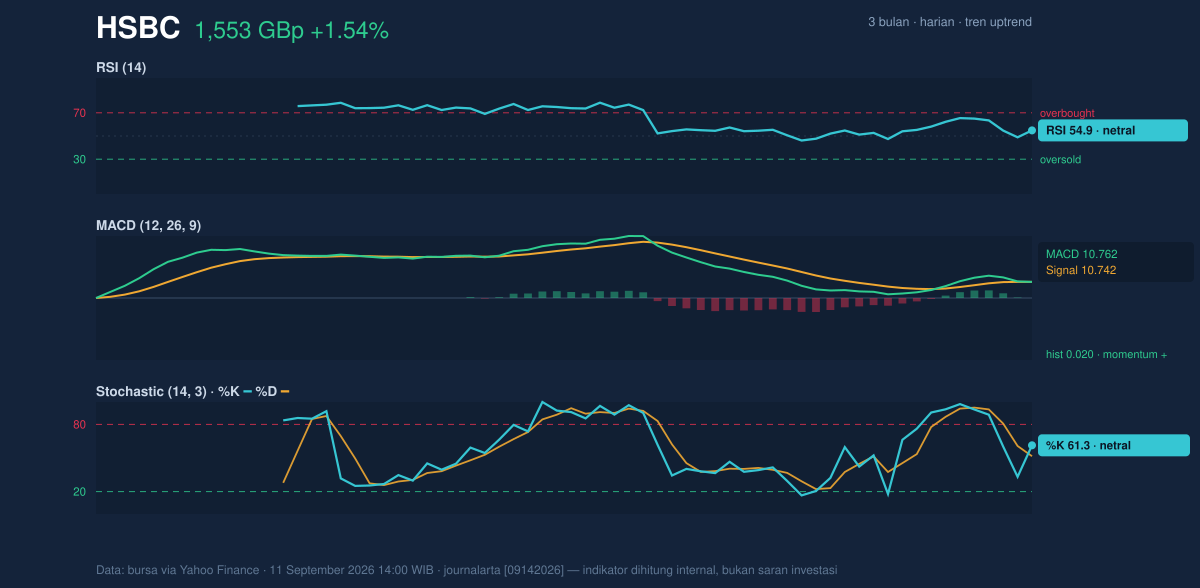
That combination — neutral oscillators with a slight MACD edge — usually describes a market that is consolidating gains rather than losing them. It is a calmer setup than a runaway rally, but it is also less vulnerable to an abrupt reversal.
Volatility & Volume
Bollinger Bands are helping explain the current setup. HSBC is trading below the upper band at 1,583.54, above the middle band at 1,534.96, and well above the lower band at 1,486.38. The %B at 68% shows price is leaning toward the upper half of the band structure, which typically reflects constructive momentum without yet reaching the kind of extreme that often signals exhaustion.
More importantly, the 6.3% band width indicates a squeeze. A squeeze means volatility has narrowed, and when price compresses like this, the market often prepares for a larger move. That does not predict direction on its own, but with HSBC already above both key moving averages, the compression is occurring in a bullish context. If the stock can clear nearby resistance, the squeeze could release into a sharper move.
The ATR(14) at 28.81, equal to 1.9% of price, points to moderate daily volatility. That suggests normal day-to-day swings are still manageable, but a breakout attempt could travel quickly once it starts.
Volume is the caution flag. Last volume was 9,108,205, well below the 20-day average of 17,440,496, or about 0.5x normal activity. Thin participation can weaken the reliability of a move, because price is advancing without broad confirmation. Yet OBV is rising, which means the cumulative volume trend still supports the price structure. In other words, the latest session was quiet, but the wider flow of volume has not turned against the stock.
Key Levels & Scenarios
The immediate technical map is clear. Resistance at 1,580.20 is the first barrier, and the upper Bollinger band at 1,583.54 sits just above it, making that zone a tight test of upside conviction. If HSBC clears that area, the next visible reference is the 3-month high at 1,610.00. On the downside, support at 1,497.20 is the first line to watch, with the SMA50 at 1,522.94 and SMA20 at 1,534.96 acting as layered trend support.
A break above resistance would suggest the squeeze is resolving upward. A failure to hold support would imply the market is losing its short-term grip, even if the broader trend has not fully broken.
Technical Verdict: HOLD (wait & see)
HOLD (wait & see)
- MACD is slightly positive, so momentum still favors the upside, but only modestly.
- Price above SMA20 and SMA50 keeps the trend constructive.
- Bollinger squeeze signals a possible expansion in volatility, but volume is only 0.5x average, so confirmation is lacking.
Verdict invalidated if price falls below 1,497.20.
- Ideal Entry Range: 1,534.96 to 1,552.60, using the SMA20 area and current price zone as the active trend band.
- Exit Target: 1,580.20 to 1,583.54, matching resistance and the upper Bollinger band.
- Stop Loss Protection: below 1,497.20, where short-term support fails.
For non-traders, this means HSBC looks technically steady, but the market still needs stronger participation before the next move is confirmed.
HSBC’s latest volume was 9,108,205 shares versus a 20-day average of 17,440,496.
Summary Data HSBC
| Last price | 1,552.60 GBp |
| Change 1 day / 5 days / 1 month | 1.54% / -1.75% / 1.76% |
| Trend / MA-cross | uptrend / none |
| SMA20 / SMA50 | 1,534.96 / 1,522.94 |
| RSI (14) / Stochastic %K | 54.9 / 61.3 |
| Bollinger %B / ATR | 68% / 28.81 |
| Support / Resistance 20 days | 1,497.20 / 1,580.20 |
| Data as of | 11 September 2026 14:00 WIB |
