T Stock Analysis: Gains 2.00%, Testing Key Resistance
On September 14, 2026: price 26.06 USD, trend uptrend, RSI 61.6, support 24.68, resistance 26.19. technical analysis of t stock. Stock Analysis — full details…

AT&T edged up to 26.06 USD on 11 September 2026, adding 2.00% in the session and lifting the shares to 91% of the 20-hour trading range, according to Yahoo Finance data cited in the market feed. The move matters because it leaves the stock pressing against nearby resistance rather than drifting in the middle of its range. That is usually where technical readings start to matter more than the day’s headline.
Trend & Price Action
The shares remain in an uptrend, and the slope of the SMA20 — up 1.36% over five days — shows the short-term trend is still rising. Price is trading above the SMA20 at 25.54 USD and well above the SMA50 at 23.86 USD, which tells the market is still rewarding recent buyers and that the medium-term base is intact. There is no fresh MA-cross, so the chart is not flashing a new trend-change signal; instead, it is showing a trend that has already been in place and is now being tested near the top of its band.
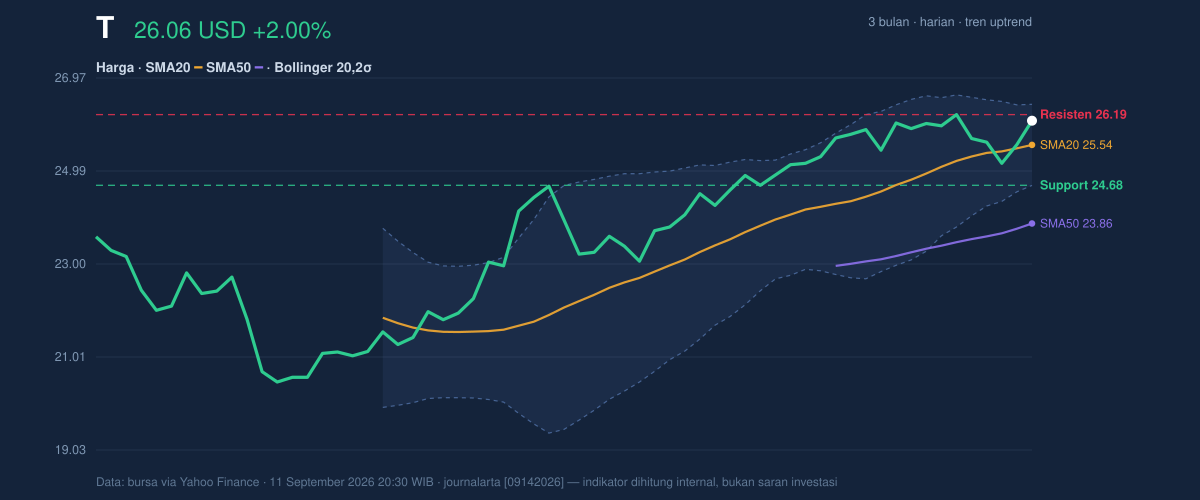
The most important detail in the price structure is that AT&T is sitting just below 20-hour resistance at 26.19 USD, while the nearest 20-hour support is 24.68 USD. With the stock near the upper edge of its recent range and the 3-month high at 26.44 USD only slightly above, the market is effectively asking whether this move is a breakout attempt or just another approach to a ceiling. The answer is not in the day’s gain alone; it is in whether price can stay above the middle Bollinger band and keep pressure on the upper band.
Oscillators & Momentum
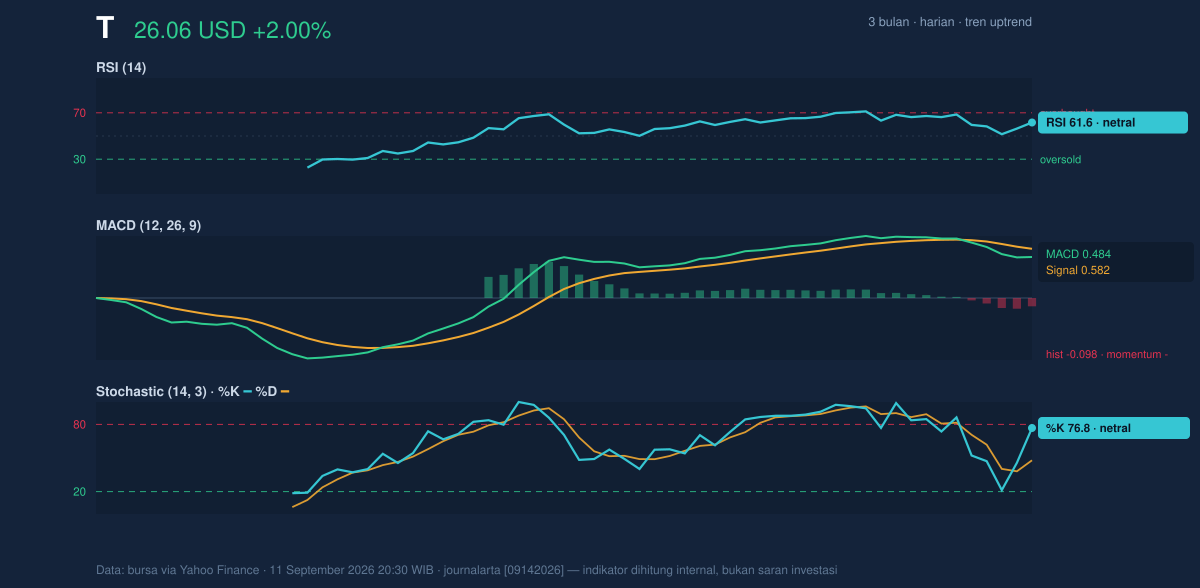
Momentum is more mixed than the price trend. The RSI(14) at 61.6 is still in a neutral-to-firm zone, which means the stock is not overextended in the classic sense, but it is also no longer early in the move. The Stochastic %K at 76.8 versus %D at 48.0 shows short-term price action has accelerated faster than its recent average, a pattern that often appears when a stock is leaning toward the top of its range. That does not guarantee reversal; it does mean the move is getting stretched.
The more cautionary signal comes from MACD at 0.484 below the signal line at 0.582, with a -0.098 histogram. In plain language, MACD is still positive, but the pace of momentum is slipping. This is the kind of reading that often appears when price is rising but the push behind it is weakening. For readers, that means the trend is still up, but the engine is not firing as strongly as the chart’s location might suggest. AT&T is advancing, yet it is doing so with less internal force than the price alone implies.
Volatility & Volume
The Bollinger Bands add an important layer. The band width is only 6.8%, described as a squeeze, which signals compressed volatility and the potential for a larger move once the range breaks. Price is trading with %B at 80%, meaning it is closer to the upper band at 26.41 USD than the lower band at 24.68 USD. That positioning usually indicates strength, but in a squeeze it also warns that the stock may be approaching the point where it has to choose direction.
Volume supports the move, at least partially. The latest volume of 43,220,300 is about 1.3× normal versus the 20-hour average of 32,282,215, which suggests real participation rather than a thin, easily reversed drift. But the OBV is down, and that divergence matters. OBV, or on-balance volume, is a running measure of whether volume is accumulating behind price gains or fading away. A falling OBV while price climbs can mean buyers are present, but not fully committed over time. In other words, the market is lifting AT&T, but not with clean, broad accumulation.
ATR(14) at 0.53, about 2.0% of price, points to moderate volatility. That is enough room for a meaningful move, but not enough to suggest a disorderly swing is already underway. Combined with the squeeze, it argues for a stock that could soon move more decisively if resistance gives way.
Key Levels & Scenarios
The chart’s immediate battleground is clear. 26.19 USD is the first level that has to be cleared to confirm that the stock is not simply stalling under resistance. Above that, the next reference is the 3-month high at 26.44 USD, which is the obvious ceiling in the current data. On the downside, 24.68 USD is the first support to watch, and it also aligns with the lower Bollinger band, making it a technically important floor.
If AT&T can hold above the SMA20 at 25.54 USD and push through 26.19 USD, the chart would shift from a range-test to a more convincing continuation pattern. If it fails to hold 24.68 USD, the squeeze would lose its bullish character and the recent advance would start to look more fragile.
Technical Verdict: HOLD (wait & see)
HOLD (wait & see)
- Price is above the SMA20 and SMA50, which keeps the broader trend constructive.
- MACD is below its signal line, showing momentum is weaker than the price move suggests.
- Bollinger Bands are squeezed, meaning the stock may be preparing for a larger move, but direction is not yet confirmed.
Verdict invalidated if price falls below 24.68 USD, because that would break support and weaken the current range structure.
- Ideal Entry Range: 25.54 to 24.68 USD
- Exit Target: 26.19 to 26.44 USD
- Stop Loss protection: below 24.68 USD
In plain English: the stock is still firm, but the chart is asking for confirmation before the next move becomes clear.
“That is where the market is now — close enough to resistance that every tick matters.”
Summary Data T
| Last price | 26.06 USD |
| Change 1 day / 5 days / 1 month | 2.00% / -0.50% / 6.02% |
| Trend / MA-cross | uptrend / none |
| SMA20 / SMA50 | 25.54 / 23.86 |
| RSI (14) / Stochastic %K | 61.6 / 76.8 |
| Bollinger %B / ATR | 80% / 0.53 |
| Support / Resistance 20 days | 24.68 / 26.19 |
| Data as of | 11 September 2026 20:30 WIB |



