Tencent Stock Gains 0.66%, Testing Support Level In Focus
On September 14, 2026: price 428.40 HKD, trend downtrend, RSI 39.4, support 425.60, resistance 457.00. technical analysis of tencent stock.

Tencent Holdings slipped further below its short-term trend line on HKEX in Hong Kong on 11 September, with 0700.HK last at HKD 428.40, up 0.66% on the day but still trapped below its SMA20 at HKD 442.25 and well under its SMA50 at HKD 455.98. The move matters less as a one-day bounce and more as a signal that sellers still control the broader tape: the stock is trading inside the lower half of its recent range, the short-term average is sloping down, and momentum has not yet turned strong enough to argue that the decline has exhausted itself.
Trend & Price Action
The chart shows a stock that is still behaving like a downtrend, not a clean reversal. Tencent’s price is below the SMA20, and the SMA20 slope of -1.48% over 5 days says the near-term trend is still pointing lower rather than flattening out. With no fresh MA-cross, there is no new moving-average confirmation that buyers have regained control. That matters because moving-average crosses are often watched as a proxy for trend change: without one, the market is more likely to be reacting than repricing.
The stock is also sitting close to the lower edge of its Bollinger framework. The lower band at HKD 425.67 is almost directly under the last price of HKD 428.40, while the middle band at HKD 442.25 coincides with the SMA20. In plain terms, Tencent is not reclaiming trend; it is hovering near the point where short-term support either starts to work or gives way. The fact that the %B is only 8% means price is very near the bottom of the band structure, which often signals either an oversold condition or a market that is still under pressure and not yet ready to mean-revert. The distinction will be decided by whether the support zone holds.
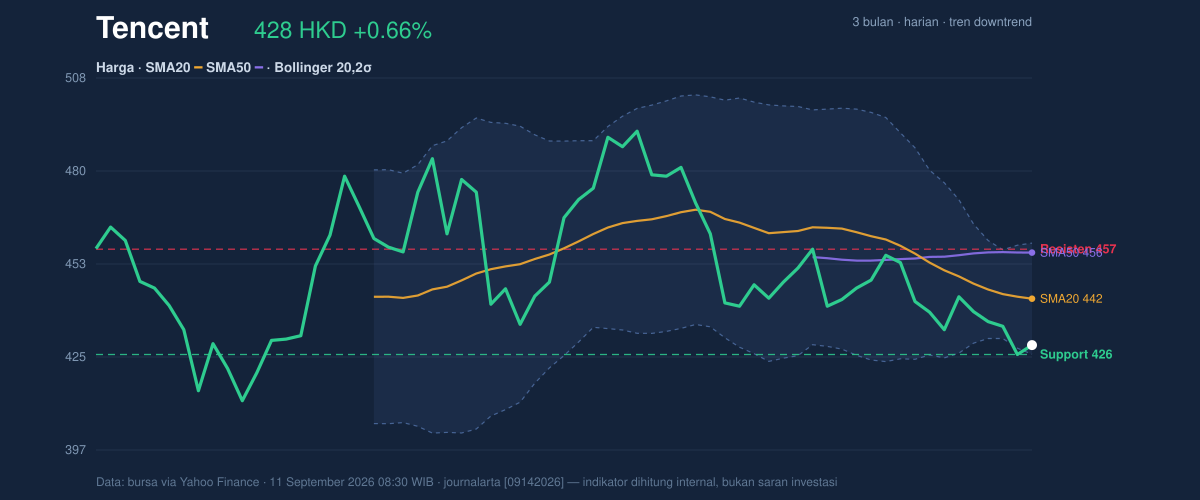
Support at HKD 425.60 is the first line the market is defending, while resistance at HKD 457.00 marks the first area where a rebound would need to prove itself. The stock is positioned at roughly 9% of its 20-hour range, which is another way of saying it is trading close to the bottom of that band rather than in the middle. It is also still below the 3-month high of HKD 497.80 and above the 3-month low of HKD 411.00, so the chart sits in the lower half of a broader range, not at a climactic breakdown point.
A small bounce is not the same thing as a trend change.
It still needs confirmation.
Oscillators & Momentum
The momentum picture is mixed on the surface, but still leans negative underneath. The RSI at 39.4 is technically neutral, yet it is sitting below the midpoint that usually separates firm strength from weak tape. That means Tencent is not deeply oversold, but it is also not showing the sort of momentum that typically accompanies a sustained recovery. The Stochastic %K at 21.0 and %D at 8.9 are also neutral, but they are near the lower end of the scale, which suggests the stock is still in a weak momentum pocket rather than a strong rebound phase.
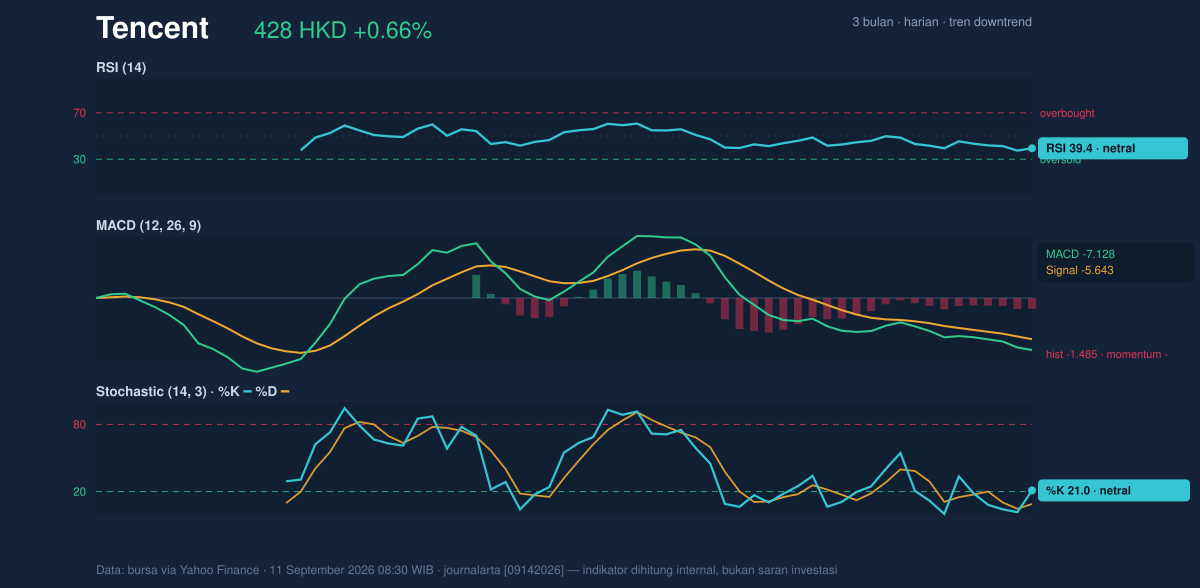
The more important signal is the MACD at -7.128, below its signal line at -5.643, with a histogram of -1.485. In practical terms, that means downward momentum is still stronger than the recent pace of recovery. MACD is often used to gauge whether a move is accelerating or losing force; here, it says the sellers still have the upper hand even if the day’s price change looked positive. So while RSI and Stochastic are not screaming oversold, MACD is not yet confirming a durable turn.
Volatility & Volume
Volatility is present, but not extreme. Tencent’s ATR(14) at 9.39 equals about 2.2% of price, which points to a market capable of moving, but not in panic mode. More interesting is the Bollinger setup: the band width is only 7.5%, described here as a squeeze. That matters because tight bands often precede a sharper move; they do not tell direction on their own, but they do warn that the market is coiling. If the price escapes the current band structure, the move could be faster than recent trading has suggested.
Volume, however, is not helping the rebound case yet. Last volume was 15,628,379, below the 20-hour average of 19,026,230, or about 0.8x normal. That tells us the day’s gain was not backed by strong participation. In trend analysis, price rising on lighter volume can be fragile because it suggests fewer market participants are committed to the move. The OBV is falling, which reinforces that distribution has still been more influential than accumulation. In short, the tape is not showing broad buying pressure yet.
Key Levels & Scenarios
The immediate decision point is simple: HKD 425.60 on the downside and HKD 442.25 on the upside. A hold above support would keep the stock inside the lower band and leave room for a technical rebound toward the middle band. A failure at support would expose the next layer of weakness, with the broader chart still framed by the 3-month low at HKD 411.00. On the upside, a move back above the SMA20 and middle Bollinger band would be the first sign that the market is trying to repair trend rather than merely bounce.
Technical Verdict: HOLD (wait & see)
- MACD remains negative, so downside momentum is still dominant.
- Price is below SMA20 and SMA50, and the SMA20 is still sloping down, which keeps the trend biased lower.
- Volume is only 0.8x normal and OBV is falling, so the rebound lacks confirmation from participation.
Verdict invalidated if price breaks below HKD 425.60, because that would mean the nearest support and lower Bollinger boundary are failing together.
- Ideal Entry Range: HKD 425.60–442.25, where support and the SMA20/Bollinger middle band sit.
- Exit Target: HKD 457.00, the first resistance level.
- Stop Loss protection: below HKD 425.60, with the broader downside risk extending toward HKD 411.00 if support gives way.
For non-traders: Tencent is not breaking down aggressively, but it has not yet shown enough strength to prove the slide is over.
“Right now, the market is asking Tencent to prove it can hold its footing before anyone believes the bounce.”
Summary Data Tencent
| Last price | 428.40 HKD |
| Change 1 day / 5 days / 1 month | 0.66% / -3.25% / -2.64% |
| Trend / MA-cross | downtrend / none |
| SMA20 / SMA50 | 442.25 / 455.98 |
| RSI (14) / Stochastic %K | 39.4 / 21.0 |
| Bollinger %B / ATR | 8% / 9.39 |
| Support / Resistance 20 days | 425.60 / 457.00 |
| Data as of | 11 September 2026 08:30 WIB |



