VZ Stock Technicals Today: Gains 1.28%, Testing Key Resistance
On September 14, 2026: price 50.61 USD, trend uptrend, RSI 62.7, support 48.06, resistance 50.61. technical analysis of vz stock. VZ Stock Technicals — full…

Verizon Communications edged higher on the NYSE to 50.61 USD on 11 September 2026, extending a short-term uptrend even as several momentum gauges suggest the move is running into resistance. The stock is now trading above its SMA20 at 49.76 and well above its SMA50 at 46.93, which tells the market that the intermediate trend remains constructive, but the latest push has arrived at a technically crowded zone near the top of the recent range.
Trend & Price Action
The broad message from the chart is straightforward: Verizon is still in an uptrend, but the pace has become more hesitant. The price is above the SMA20, and the slope of that short-term average is rising at 1.46% over 5 days, a sign that buyers have been in control for more than just one session. At the same time, the stock’s 1.28% one-day gain stands in contrast with its 0.04% five-day change, which suggests the recent advance has been more of a fresh burst than a sustained climb.
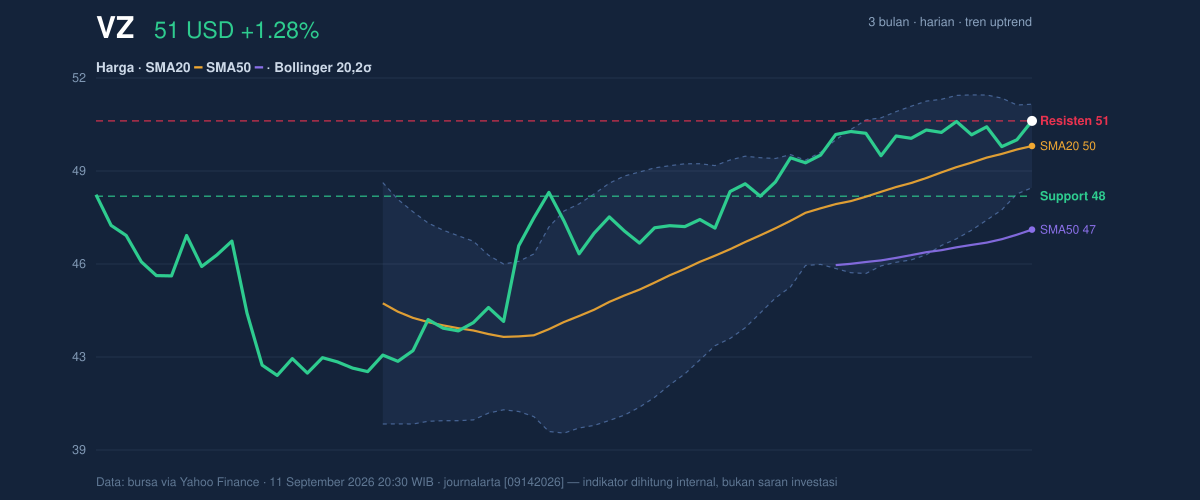
That matters because Verizon is now sitting at 100% of its 20-hour range, with 20-hour support at 48.06 and 20-hour resistance at 50.61. In plain English, the stock has reached the ceiling of its near-term trading band. It is also pressing against the 3-month high of 50.93, which is the kind of level that often attracts profit-taking or forces a stock to prove it has enough demand to break higher.
Oscillators & Momentum
Momentum is less supportive than price alone would suggest. The RSI at 62.7 is still in neutral territory, which means the stock is not yet stretched enough to scream exhaustion. But the Stochastic %K at 84.8 versus %D at 61.0 is clearly in overbought territory, showing the latest move has advanced faster than the underlying trend has fully digested. That is often a warning that short-term enthusiasm is ahead of confirmation.
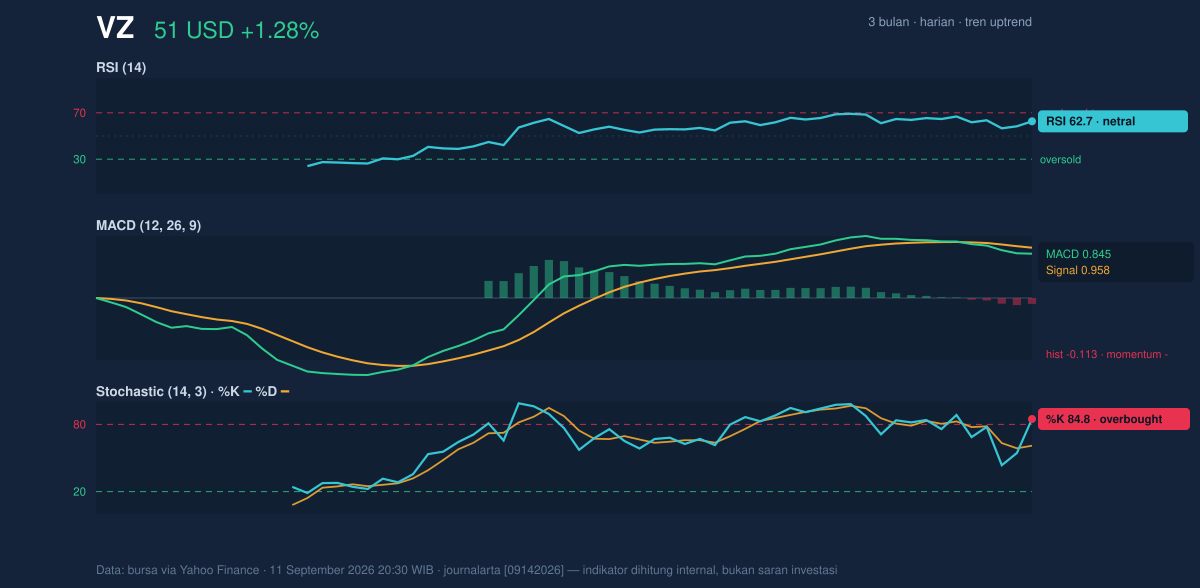
The more important tell is the MACD histogram at -0.113, with MACD at 0.845 below its signal line at 0.958. For readers less familiar with the term, MACD is a trend-following indicator; when the histogram turns negative, it means momentum is weakening even if price is still rising. In other words, Verizon is making higher ground, but the internal engine is not accelerating with it. That divergence is the main reason the chart looks more like a consolidation candidate than a clean breakout candidate right now.
Volatility & Volume
The Bollinger Bands add another layer to that reading. Verizon is trading with %B at 80%, which places the price in the upper part of the band structure, close to the top band at 51.17. The band width is only 5.7% and is described as a squeeze, meaning volatility has been compressing. Squeezes often precede a larger move, but they do not tell direction on their own; the direction usually depends on whether price can hold above resistance with conviction or slips back toward the middle band.
The volatility backdrop is not wild. ATR at 0.85, or 1.7% of price, points to moderate day-to-day movement rather than a disorderly tape. That makes the current setup more about whether buyers can sustain pressure than about abrupt swings. Volume is a little softer than normal, with 16,456,300 shares traded versus a 20-hour average of 17,414,375, or 0.9x normal. That matters because breakouts are usually more convincing when volume expands; here, participation is acceptable but not emphatic. The one encouraging counterweight is that OBV is rising, which indicates accumulated buying pressure has not disappeared even if today’s turnover is modest.
Key Levels & Scenarios
The chart’s structure is now tightly defined. The immediate ceiling is the 3-month high at 50.93, just above the current price, while the nearest chart support sits at 48.06. Below that, the SMA20 at 49.76 and the Bollinger middle band at 49.76 act as the first line of trend support, and the lower band at 48.35 marks the area where a squeeze can start to unwind.
If Verizon can hold above the 49.76 area and push through 50.93, the squeeze setup argues for a potential expansion move, because compressed bands often release energy once price escapes the top of the range. If instead the stock fails to clear the high and slips back below the 20-hour support at 48.06, the recent advance would start to look like a failed breakout attempt rather than trend continuation. The key point is not that the stock is weak; it is that the chart is asking for confirmation.
Technical Verdict: HOLD (wait & see)
HOLD (wait & see) fits best because the trend is positive, but momentum and participation are not yet strong enough to confirm upside follow-through.
- Reason 1: Price remains above the SMA20 at 49.76 and SMA50 at 46.93, so the medium-term trend is still intact.
- Reason 2: Stochastic is overbought and the MACD histogram is negative, which signals fading momentum even as price tests resistance.
- Reason 3: Bollinger Bands are squeezing while volume is only 0.9x normal, so the market has not yet shown strong confirmation of a breakout.
- Invalidation: this verdict is invalidated if price falls below 48.06, because that would break the nearest support and weaken the current uptrend structure.
- Ideal Entry Range: 49.76 to 48.35
- Exit Target: 50.93 to 51.17
- Stop Loss protection: below 48.06
For non-traders, this means Verizon is still climbing, but the chart is asking for proof before the next leg higher. “It’s close, but it hasn’t yet earned the breakout.”
Summary Data VZ
| Last price | 50.61 USD |
| Change 1 day / 5 days / 1 month | 1.28% / 0.04% / 4.96% |
| Trend / MA-cross | uptrend / none |
| SMA20 / SMA50 | 49.76 / 46.93 |
| RSI (14) / Stochastic %K | 62.7 / 84.8 |
| Bollinger %B / ATR | 80% / 0.85 |
| Support / Resistance 20 days | 48.06 / 50.61 |
| Data as of | 11 September 2026 20:30 WIB |


