QCOM Stock Technicals Today: Gains 4.25%, Golden Cross Formed
On September 16, 2026: price 187.80 USD, trend uptrend, RSI 69.2, support 158.53, resistance 187.80. technical analysis of qcom stock. QCOM Stock Technicals —…

Qualcomm shares on NASDAQ climbed to 187.80 USD on 15 September 2026, extending a steady advance that has lifted the stock 4.25% in one day, 7.88% over five days and 15.80% over one month, according to Yahoo Finance data. The move matters because it is not just a one-session spike: the price is now trading above both short- and medium-term trend gauges, while volume and momentum signals show buyers are still participating. At the same time, the stock is pressing into the upper edge of its recent range, where rallies often start to meet tests of stamina.
Trend & Price Action
The chart shows Qualcomm in a clear short-term uptrend, with the price sitting above the SMA20 at 168.85 and the SMA20 above the SMA50 at 168.71, forming a golden cross. In plain English, that crossover means the recent pace of prices has overtaken the slower trend line, a sign that momentum has shifted in favor of buyers rather than sellers. The SMA20 slope of 2.57% over five days reinforces that the trend is still rising, not merely bouncing. With the stock at 100% of its 20-hour range and near the 20-hour resistance at 187.80, the market is telling us the move has reached a decision point: either momentum can absorb overhead supply, or it pauses to reset.
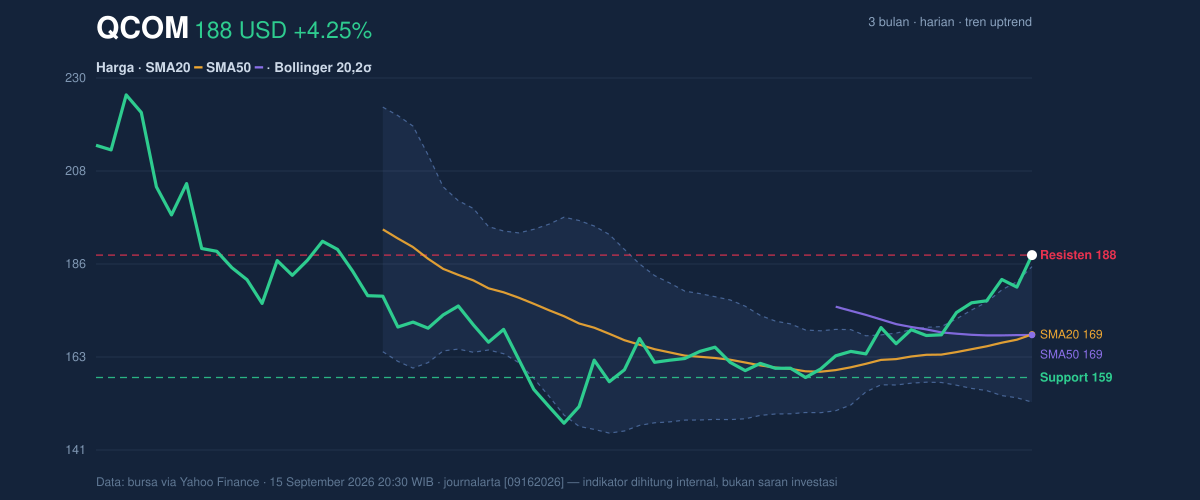
The Bollinger Band structure adds an important nuance. Price is trading above the upper band at 185.05, with %B at 109%, which means the stock has pushed beyond the band rather than simply riding inside it. That is usually a sign of strength, but also of stretch. The band width at 19.2% is described as normal, so this is not a classic squeeze breakout where volatility is just beginning to expand; instead, it looks like an already-moving trend that is now extended.
A strong trend, but not a cheap one.
Oscillators & Momentum
The momentum picture is mixed, and that mix is what makes the current setup interesting. The RSI at 69.2 sits in a neutral-to-firm zone, close to the overbought threshold but not yet flashing a hard reversal signal. The Stochastic %K at 92.5 and %D at 86.8 are more aggressive: that is an overbought reading, showing the stock is closing near the top of its recent trading bands and may be vulnerable to a pause if fresh buyers do not arrive. By contrast, the MACD at 3.965 versus a signal line at 1.423, with a histogram of 2.541, shows positive momentum remains intact. Put simply, the trend is still accelerating faster than its own average, which is why the stock can stay overbought for a while in a strong run.
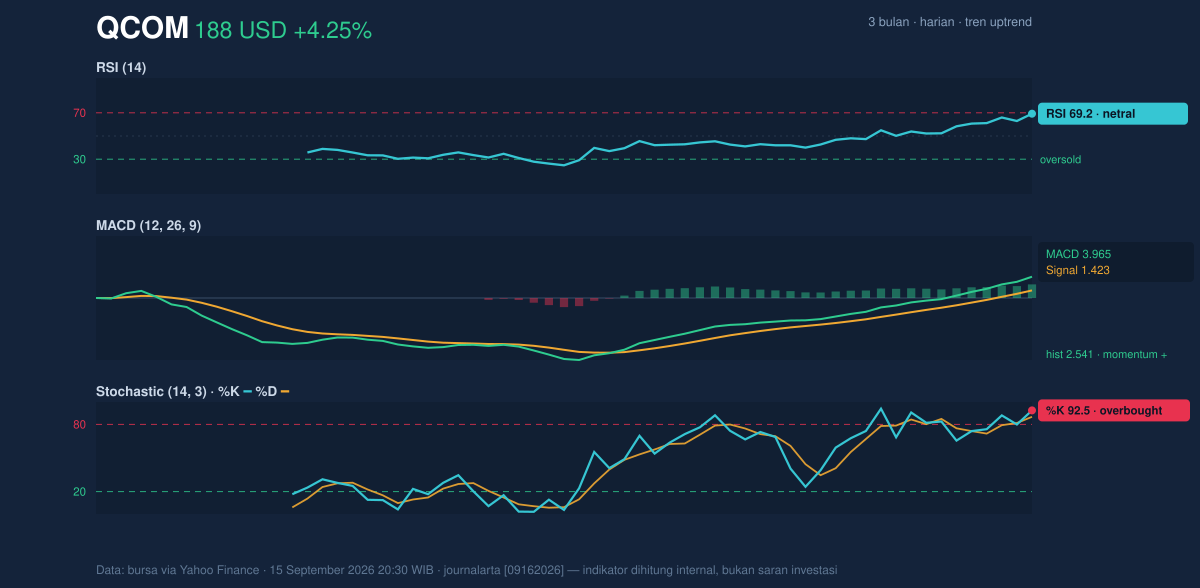
That combination — strong MACD, stretched Stochastic, and RSI not yet extreme — usually signals a market that is still constructive, but increasingly selective. Traders often read that as “trend intact, entry quality less forgiving.”
Volatility & Volume
Volatility is elevated enough to matter. The ATR(14) of 7.65, equal to 4.1% of price, indicates the stock can move several dollars in a normal session. For readers unfamiliar with ATR, it measures how much a stock typically travels each day; a higher reading means wider intraday swings and less room for complacency. That matters here because Qualcomm is already trading near the top of its recent band, where a high ATR can turn a routine pullback into a noticeable retracement.
Volume offers confirmation rather than warning. The latest volume of 13,841,400 was about 1.2× the 20-session average of 11,590,755, and OBV is rising. OBV, or on-balance volume, tracks whether volume is flowing into up days or down days; a rising OBV alongside a rising price generally means the advance is being supported by real participation, not just thin trading. That is important because breakouts without volume often fade quickly. Here, the tape still has sponsorship.
The market is stretched, but it is not empty.
Key Levels & Scenarios
The most immediate reference points are clear from the chart. Support at 158.53 is the first level where buyers previously showed up, while resistance at 187.80 is the current ceiling the stock is testing. Because the price is already at the top of the 20-hour range, the next move is likely to be defined by whether it can hold above this breakout zone or slip back into the body of the range.
If Qualcomm can remain above 185.05 and sustain trade over 187.80, the chart suggests continuation of the current trend, with the upper band no longer acting as a cap. If it fails to hold the upper band and momentum cools, the first area to watch is the SMA20 at 168.85, which doubles as the Bollinger middle band and the trend’s short-term pivot. Below that, the market would start to look more like a failed extension than a healthy pause.
Technical Verdict: HOLD (wait & see)
HOLD (wait & see)
- MACD remains positive, with the histogram still expanding, which supports the existing uptrend.
- Stochastic is overbought, and the price is above the upper Bollinger band at 185.05, signaling extension rather than fresh setup quality.
- Volume is 1.2× normal and OBV is rising, so the move is still backed by participation, but the stock is now testing overhead resistance at 187.80.
Verdict invalidated if price breaks below 168.85.
- Ideal Entry Range: 168.85 to 185.05
- Exit Target: 187.80
- Stop Loss protection: 158.53
For non-traders: the chart still points upward, but the stock is extended enough that the next move could be either a breakout or a pause.
Summary Data QCOM
| Last price | 187.80 USD |
| Change 1 day / 5 days / 1 month | 4.25% / 7.88% / 15.80% |
| Trend / MA-cross | uptrend / golden |
| SMA20 / SMA50 | 168.85 / 168.71 |
| RSI (14) / Stochastic %K | 69.2 / 92.5 |
| Bollinger %B / ATR | 109% / 7.65 |
| Support / Resistance 20 days | 158.53 / 187.80 |
| Data as of | 15 September 2026 20:30 WIB |


