Testing Key Resistance, PG Stock Gains 0.37% Today
On September 16, 2026: price 146.67 USD, trend sideways, RSI 53.6, support 142.64, resistance 147.64. technical analysis of pg stock. Testing Key Resistance —…

Procter & Gamble’s shares ended at 146.67 on the NYSE, up 0.37% on the day and 2.48% over the past month, with the stock sitting in the upper part of its recent trading range as investors weigh a market that is still moving sideways rather than trending decisively. The signal that matters most is not the modest gain itself, but that price is holding above the short-term average while the broader setup remains compressed, a combination that often precedes a larger move once direction is chosen.
Trend & Price Action
The chart shows PG trading above its SMA20 at 145.05 but just above the SMA50 at 146.26, which tells a simple story: short-term momentum has improved enough to reclaim the near-term trend line, but the longer baseline is still close enough to act as a gatekeeper. With no fresh MA-cross, there is no clean trend reset yet. In plain terms, the stock is not breaking out from a strong downtrend or accelerating in a strong uptrend; it is still in a sideways phase, and the narrow 0.08% five-day slope on the SMA20 confirms that direction is still being negotiated.
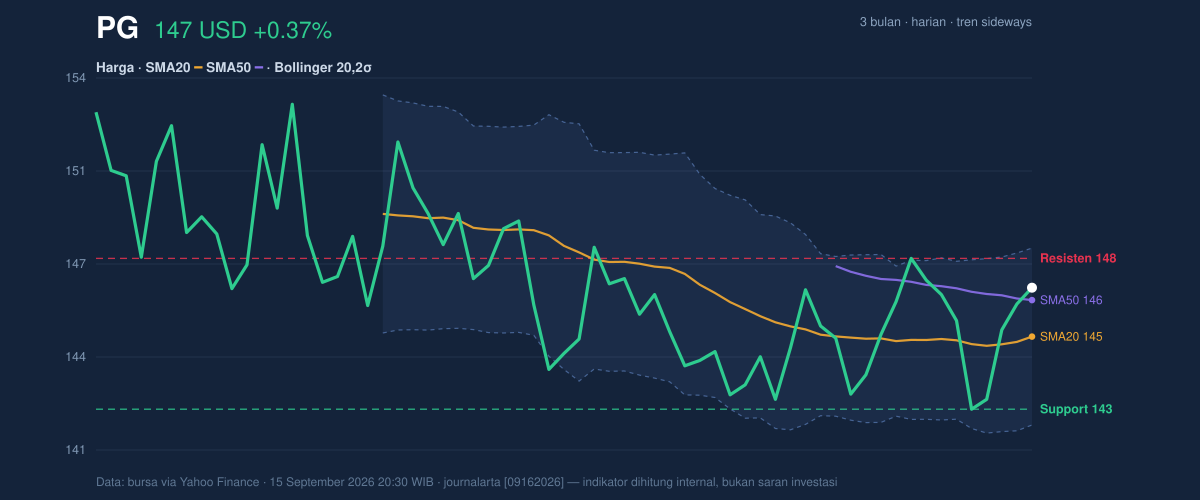
The position within the range also matters. PG is trading at 81% of its 20-hour range, with support at 142.64 and resistance at 147.64. That means buyers have been willing to defend pullbacks, but the stock is now pressing into the upper boundary where enthusiasm often meets supply. The three-month high of 154.32 and low of 140.20 frame the bigger picture: the shares are closer to the top of that band than the bottom, but still well below the peak, which suggests recovery has room only if the near-term ceiling gives way.
A tight range can be a warning sign or a springboard.
Oscillators & Momentum
Momentum indicators are mostly constructive, but not emphatic. The RSI at 53.6 is neutral, which means the stock is neither stretched nor washed out. That matters because it leaves room for continuation if buyers gain control, but it also shows there is no overbought urgency forcing a reversal. The Stochastic %K at 74.0 and %D at 64.1 lean firmer than RSI and sit near the upper part of their scale, hinting that recent buying has been stronger than the broader momentum reading suggests. This kind of setup often appears when price is advancing, but not yet with enough conviction to call it a breakout.
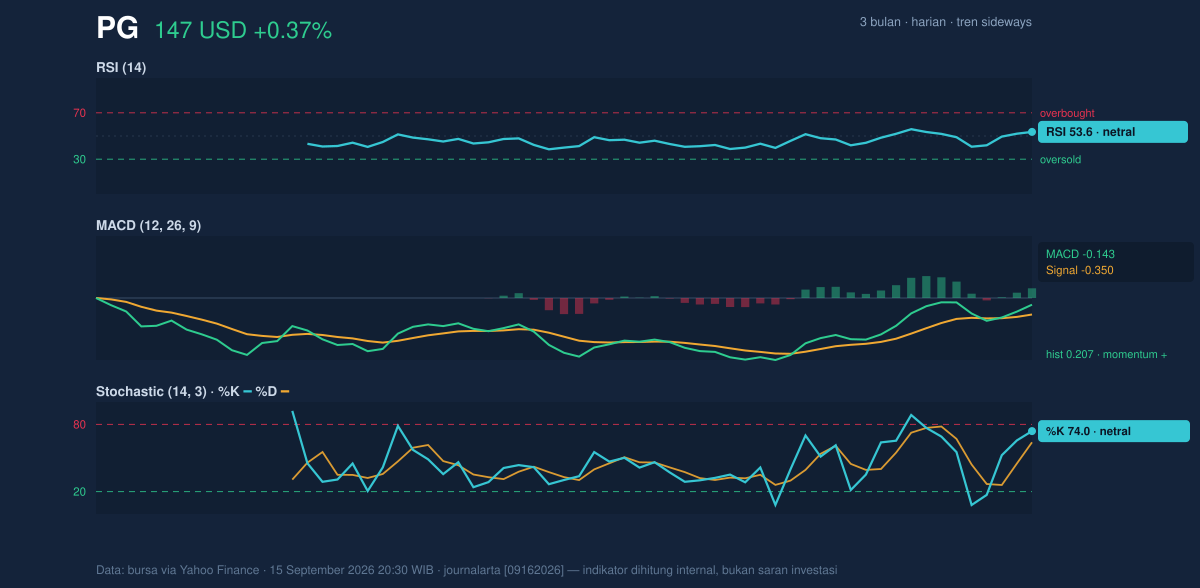
The most encouraging signal is the MACD at -0.143 versus the signal line at -0.350, leaving a positive histogram of 0.207. For non-specialists, that means the faster trend measure is moving above the slower one, which usually points to improving momentum even if the indicator itself is still below zero. In other words, the stock is not in a full bullish trend, but the internal direction has turned more favorable. That is a subtle but important distinction: momentum is improving faster than price has fully reflected.
Volatility & Volume
Volatility is moderate, not explosive. The ATR at 2.33, equal to 1.6% of price, suggests a typical daily move that is large enough to matter but not large enough to imply disorder. The Bollinger Bands add a more interesting layer: the upper band sits at 147.98, the middle at 145.05, and the lower at 142.12, with %B at 78% and band width at 4.0%. A narrowing band is often read as a squeeze, meaning volatility has contracted and the stock may be storing energy for a sharper move. Because price is already near the upper half of the band, the next expansion will be telling: it can either confirm upward pressure or reject the move if buyers fail to push through resistance.
Volume does not yet confirm a broad rush of participation. Last session volume was 8,802,900, below the 20-day average of 9,383,875, or about 0.9x normal. That matters because a move on lighter volume is easier to fade than one backed by strong turnover. Still, OBV is rising, which means the cumulative volume trend is improving even if the latest session was not exceptional. The message is mixed but constructive: participation has not surged, yet the longer volume flow is leaning in the right direction.
A breakout without volume is a question, not a confirmation.
Key Levels & Scenarios
The immediate technical map is clear. Resistance at 147.64 is the first test, closely followed by the upper Bollinger band at 147.98. If price can clear that zone, the chart would shift from range-bound to breakout-prone, especially because the bands are already tight. On the downside, support at 142.64 and the lower Bollinger band at 142.12 define the first defense area. A loss of that zone would weaken the current constructive tone and suggest the recent strength was only a pause inside the broader sideways structure.
The broader range still matters too. With the stock between the 3-month low of 140.20 and the 3-month high of 154.32, PG is neither at a deep value extreme nor at a euphoric high. It is in the middle-to-upper section of its recent map, where the next decisive move usually requires either a clear catalyst or a stronger volume response.
Technical Verdict: HOLD (wait & see)
HOLD (wait & see) because the setup is improving, but not yet decisive:
- MACD histogram is positive, showing momentum is turning up even though the line is still below zero.
- Price is above SMA20 and near SMA50, but there is no new MA-cross, so trend confirmation is incomplete.
- Bollinger Bands are squeezing, which raises breakout potential, but volume is only 0.9x normal, so confirmation is still lacking.
Verdict invalidated if price falls below 142.12, the lower Bollinger band and near-term support zone.
- Ideal Entry Range: 142.64 to 145.05
- Exit Target: 147.64 to 147.98
- Stop Loss protection: below 142.12
For non-traders, this means PG looks steadier than weak, but it has not yet proved it can move cleanly out of its current range.
Latest fact: volume closed at 8,802,900 shares, below the 20-day average of 9,383,875.
Summary Data PG
| Last price | 146.67 USD |
| Change 1 day / 5 days / 1 month | 0.37% / 0.75% / 2.48% |
| Trend / MA-cross | sideways / none |
| SMA20 / SMA50 | 145.05 / 146.26 |
| RSI (14) / Stochastic %K | 53.6 / 74.0 |
| Bollinger %B / ATR | 78% / 2.33 |
| Support / Resistance 20 days | 142.64 / 147.64 |
| Data as of | 15 September 2026 20:30 WIB |

