Momentum Gains, AMD Stock Gains 2.19% Today
On September 16, 2026: price 504.20 USD, trend sideways, RSI 54.2, support 456.16, resistance 521.10. technical analysis of amd stock. Momentum Gains — full…

For international investors watching U.S. chip stocks, AMD is holding above its short-term trend line, but not yet breaking out of the range that has contained it for months.
Advanced Micro Devices closed at 504.20 USD on Nasdaq, up 2.19% from the previous close of 493.41, according to exchange data cited via Yahoo Finance. The move matters because it lifted the shares back above both the SMA20 at 480.90 and the SMA50 at 495.10, a technical posture that usually signals improving short-term sentiment. But the chart still shows a market that is trading inside a broader sideways structure, not one that has fully escaped it.
Trend & Price Action
AMD’s trend is described as sideways, and that label is doing a lot of work here. The SMA20 slope of 0.82% over five days shows the recent drift is upward, but only modestly so, which means buyers have regained some control without forcing a decisive trend change. The absence of a new MA-cross — the point where a shorter moving average crosses above or below a longer one — also matters. It tells readers that the market has not yet produced the kind of clean technical turn that often draws stronger follow-through.
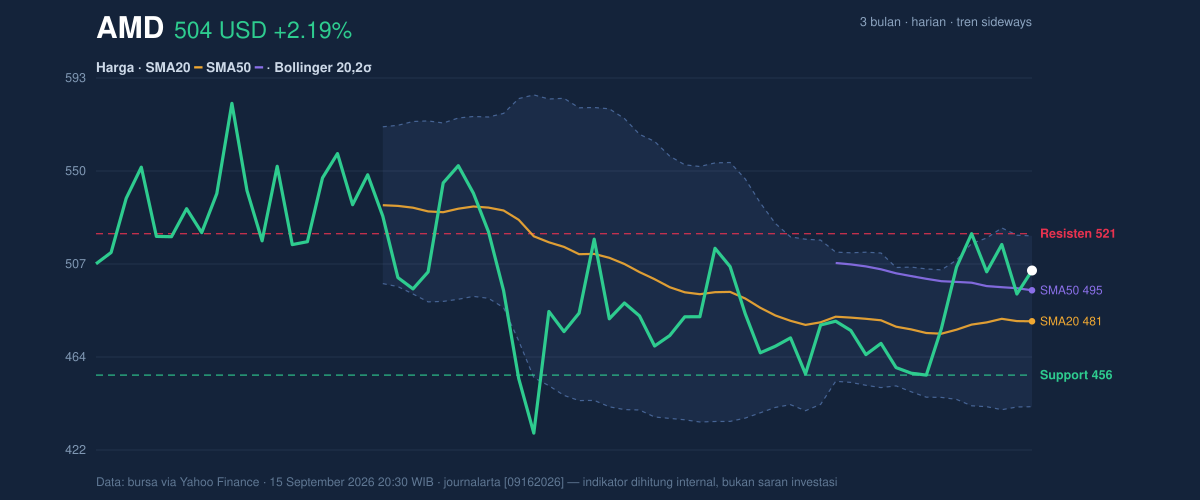
The price is sitting at about 74% of the 20-hour range, which is a constructive position because it leaves AMD closer to resistance than support. In plain terms, the market is leaning higher, but the ceiling is still visible. That is reinforced by the 3-month band: the shares remain below the 3-month high of 584.73 and well above the 3-month low of 424.03, placing them in the upper half of the recent trading envelope without threatening a breakout. The key short-term support is 456.16, while resistance stands at 521.10. Those levels frame the next meaningful test.
Oscillators & Momentum
Momentum is not flashing danger, but it is not screaming overextension either. The RSI at 54.2 is neutral, which means AMD is neither in the overheated zone nor in a washed-out condition. That is important because it suggests the latest rise is still digestible rather than stretched. The Stochastic %K at 73.8 and %D at 74.3 sits near the upper end of neutral, hinting that near-term buying has been strong enough to press the shares toward the top of the recent range, but not so extreme as to confirm a reversal signal.
The more telling signal is the MACD. AMD’s MACD at 3.821, with the signal line at -1.146 and a histogram of 4.966, points to positive momentum. For general readers, MACD is a trend-following gauge; when the main line is above the signal line and the histogram is positive, it usually means upward momentum is still building or at least holding. That aligns with the recent price recovery and the rising OBV trend, even if the broader trend label remains sideways.
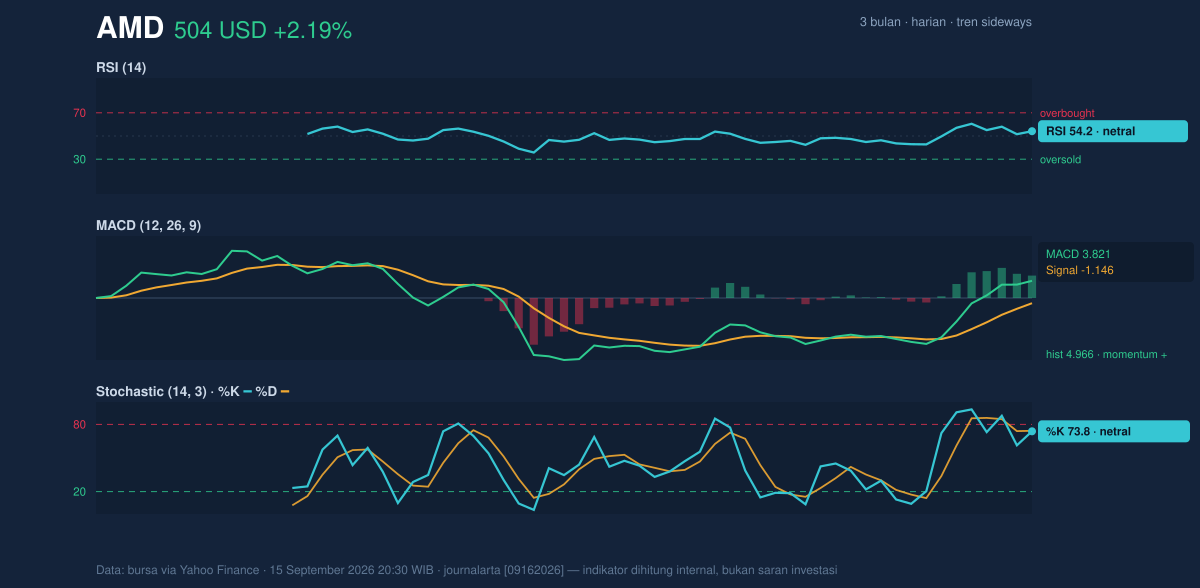
Volatility & Volume
The Bollinger Band setup adds an important layer. AMD’s price is near the upper half of the band structure, with the upper band at 520.11, the middle band at 480.90, and the lower band at 441.69. The %B reading of 80% says the shares are trading relatively close to the upper band, which often signals strength, but also warns that upside may need fresh momentum to continue without pausing. The 16.3% band width is normal, not a squeeze, so the market is not coiled for an immediate volatility expansion from compression. Instead, the setup suggests a more ordinary advance-or-fade test around resistance.
Volume does not contradict the price action. Last volume was 17,093,100, close to the 20-hour average of 17,831,765, so participation was roughly normal at 1.0×. That matters because a rally on weak volume can be suspect; here, the move was not rejected by a clear lack of trading interest. The rising OBV — on-balance volume, a measure that tracks whether volume is accumulating on up days — supports the idea that buyers have been absorbing supply, even if they have not yet forced a breakout.
Volatility remains a real factor. The ATR(14) at 19.69, equal to 3.9% of price, says daily swings can still be wide. In practical terms, AMD can move sharply enough that a clean-looking chart can change quickly, especially near the current resistance band.
Key Levels & Scenarios
The chart’s structure is now fairly clear. AMD has reclaimed the moving averages, is trading above the Bollinger midline, and has positive momentum, but it is still pressing against a resistance zone that has not yet been cleared.
If 521.10 gives way decisively, the chart would open room toward the upper Bollinger band at 520.11 and then beyond into the prior range above. If price fails there, the market is more likely to revert toward the 480.90 mid-band and the 456.16 support area. A break below that support would weaken the current recovery and shift attention back toward the lower band at 441.69.
Technical Verdict: HOLD (wait & see)
- Verdict: HOLD (wait & see)
- Reason 1: MACD is positive, showing momentum is still supportive.
- Reason 2: Price is above SMA20 and SMA50, which improves the near-term structure.
- Reason 3: RSI 54.2 and Stochastic near 74 show strength, but not a full breakout condition.
- Verdict invalidated if price falls below 456.16, the 20-hour support.
Ideal levels based strictly on the chart:
- Entry Range: 480.90 to 504.20
- Exit Target: 520.11 to 521.10
- Stop Loss: below 456.16
For non-traders, that means AMD looks firmer than it did a few sessions ago, but the market still needs proof before this recovery can be treated as more than a strong attempt. “The shares are asking for confirmation, not applause.”
Summary Data AMD
| Last price | 504.20 USD |
| Change 1 day / 5 days / 1 month | 2.19% / -0.30% / -0.36% |
| Trend / MA-cross | sideways / none |
| SMA20 / SMA50 | 480.90 / 495.10 |
| RSI (14) / Stochastic %K | 54.2 / 73.8 |
| Bollinger %B / ATR | 80% / 19.69 |
| Support / Resistance 20 days | 456.16 / 521.10 |
| Data as of | 15 September 2026 20:30 WIB |

