JPM Stock Gains 0.67%, Testing Support Level In Focus
On September 16, 2026: price 352.49 USD, trend sideways, RSI 47.2, support 350.13, resistance 363.25. technical analysis of jpm stock. JPM Stock Gains — full…

JPMorgan Chase closed at $352.49 on the NYSE on 15 September 2026, up 0.67% from the previous close of 350.13, but the broader tape still shows a stock that is trying to stabilize rather than break cleanly higher. The move matters less for its size than for its context: JPM is sitting just above its 50-day average, below its 20-day average, and inside a tightening Bollinger Band setup that often precedes a larger directional move.
Trend & Price Action
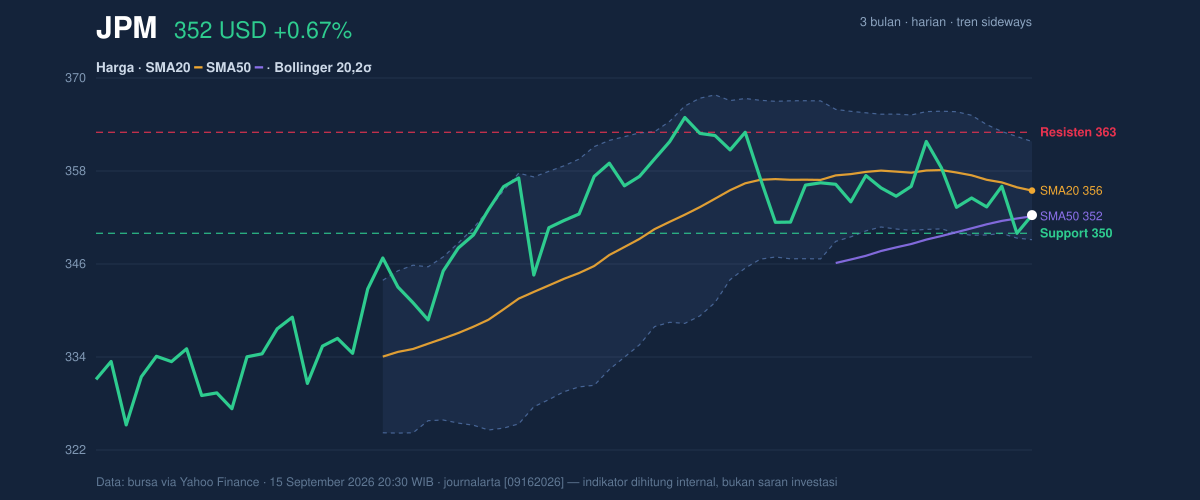
The stock remains in a sideways trend, with the SMA20 at 355.68 pointing slightly lower over the past five days at -0.66%. That slope is a useful signal: it says short-term momentum is still soft, even if the price is not breaking down. JPM is trading below the SMA20 but just above the SMA50 at 352.35, which places it in a narrow zone where neither buyers nor sellers have complete control.
This is not a strong trend-following chart. There is no fresh MA cross, so the moving averages are not confirming a new regime. Instead, the price is hovering near the middle of its recent range, with the latest close only slightly above the 20-hour support at 350.13 and well below the 20-hour resistance at 363.25. As shown in the chart, that leaves JPM in the lower part of its near-term band, with room to recover but not yet enough evidence of a decisive breakout.
Oscillators & Momentum
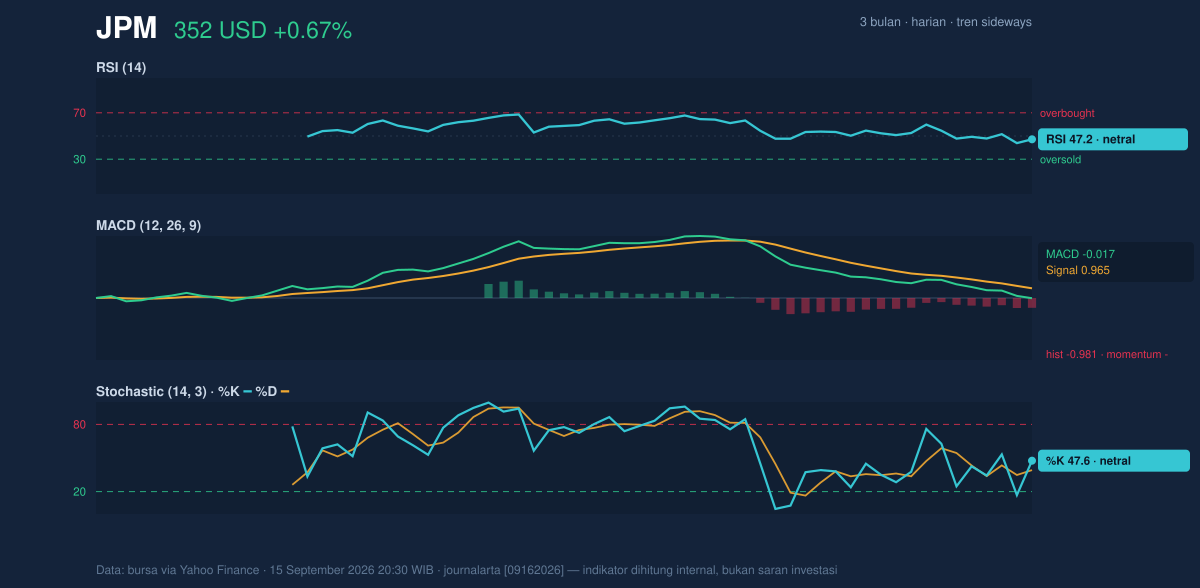
The momentum picture is mixed, and that is the key point. The RSI(14) at 47.2 is neutral, which means the stock is neither stretched upward nor washed out. In plain language, the market has not built enough enthusiasm to look overbought, but it also has not reached the kind of oversold level that often attracts bargain-hunting flows.
The Stochastic oscillator at 47.6 / 39.2 is also neutral, reinforcing the idea that JPM is moving without urgency. More importantly, the MACD at -0.017 with a signal line at 0.965 and a histogram of -0.981 points to negative momentum. That gap tells readers that recent price action is still lagging the trend signal, so even though the stock bounced on the day, the underlying impulse remains weak. In practice, this often means rallies can fade unless volume and price strength improve together.
Volatility & Volume
Volatility is not elevated, but it is becoming more interesting. The Bollinger Bands are narrowing, with a band width of 3.6%, which is a classic squeeze condition. A squeeze does not predict direction on its own; it signals compression. When price action is compressed this tightly, the next move can be larger than recent daily swings once the market chooses a side.
The current %B of 25% shows JPM is trading in the lower quarter of the Bollinger range, closer to the lower band at 349.30 than to the upper band at 362.06. That positioning matters because it suggests the stock is still leaning toward the weaker end of its short-term envelope, even after the latest bounce.
Volume gives the move more credibility than the chart alone would suggest. The latest session traded 14,026,500 shares, about 2.3× the 20-day average of 6,227,110, and OBV is rising. Rising on-balance volume means more shares are changing hands on up days than down days, which can indicate accumulation. In simple terms, the market is not just drifting; there is evidence that buyers are participating. The question is whether that participation is strong enough to overcome the still-negative MACD and the price’s position below the 20-day average.
Key Levels & Scenarios
For now, the chart revolves around a few clear levels. The first line to watch is 350.13, the 20-hour support and also the prior close. Holding above that area keeps the short-term structure intact. Below it, the lower Bollinger Band at 349.30 becomes the next technical reference, and a failure there would suggest the squeeze is resolving to the downside.
On the upside, the first meaningful hurdle is 355.68, the SMA20 and Bollinger middle band. That level matters because reclaiming it would show the stock has moved back to the center of its short-term range, not just bounced from the bottom. Above that, the next checkpoint is 363.25 at resistance, with the upper Bollinger Band at 362.06 acting as a nearby ceiling. A push through that zone would be the clearest sign that the compression phase is ending in favor of buyers.
The broader three-month range frames the setup: 366.50 remains the high, while 324.02 marks the low. JPM is trading much closer to the upper half of that range than the lower half, but not close enough to call the chart strong. The implication is straightforward: the stock is compressed, supported by volume, but still technically capped by weak momentum.
Technical Verdict: HOLD (wait & see)
HOLD (wait & see) is the cleanest technical read here because the chart shows a mix of stabilizing price and still-soft momentum. The strongest reasons are: price is below the SMA20, so short-term trend pressure has not fully turned; MACD remains negative, which means the latest bounce is not yet confirmed by momentum; and Bollinger Bands are in a squeeze, suggesting a larger move may be coming but not yet revealing direction. At the same time, volume is 2.3× the average and OBV is rising, which keeps the bullish case alive if price can reclaim overhead resistance.
The verdict is invalidated if price falls below 349.30, the lower Bollinger Band and the nearest technical support from the data.
- Ideal Entry Range: 350.13 to 355.68
- Exit Target: 362.06 to 363.25
- Stop Loss Protection: below 349.30
For non-traders, this means JPM is not weak enough to ignore, but not strong enough yet to show a clean technical breakout.
JPM’s latest close was $352.49, with 14,026,500 shares traded against a 20-day average of 6,227,110.
Summary Data JPM
| Last price | 352.49 USD |
| Change 1 day / 5 days / 1 month | 0.67% / -0.29% / -2.35% |
| Trend / MA-cross | sideways / none |
| SMA20 / SMA50 | 355.68 / 352.35 |
| RSI (14) / Stochastic %K | 47.2 / 47.6 |
| Bollinger %B / ATR | 25% / 6.27 |
| Support / Resistance 20 days | 350.13 / 363.25 |
| Data as of | 15 September 2026 20:30 WIB |

