XOM Stock Gains 2.57%, Testing Key Resistance In Focus
On September 16, 2026: price 169.32 USD, trend uptrend, RSI 65.6, support 156.44, resistance 169.32. technical analysis of xom stock. XOM Stock Gains — full…

ExxonMobil Corp. rose to 169.32 USD on the NYSE on 15 September 2026, extending a short-term advance that has carried the stock to the top of its recent range, according to Yahoo Finance data. The move came after a 1-day gain of 2.57%, with the shares also up 5.39% over 5 days and 4.87% over 1 month, a pattern that usually signals more than a one-day bounce: buyers have been willing to keep stepping in, but the stock is now pressing against a level where momentum often starts to matter more than enthusiasm.
Trend & Price Action
The broader structure remains constructive. XOM is trading above SMA20 at 162.97 and well above SMA50 at 156.39, which tells the market the intermediate trend is still pointing higher rather than merely recovering from a dip. The uptrend is reinforced by the SMA20 slope of 0.93% over 5 days, a useful sign because a rising short-term average often shows that recent buying has been persistent, not random.
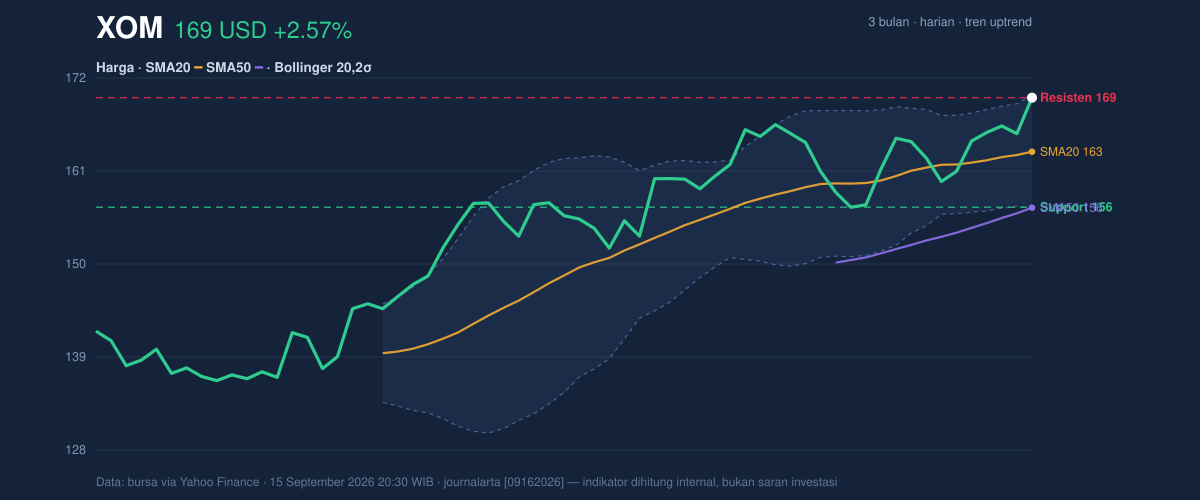
As shown in the chart, price is sitting at the very top of the visible band structure, with the 3-month high at 169.64 only slightly above the latest print and the 3-month low at 134.95 far below. That positioning matters: when a stock trades near the upper edge of its range, the market is effectively asking whether momentum can break into new territory or whether profits will be taken first. The current support at 156.44 is also important because it marks the lower edge of the 20-hour range; if that floor gives way, the recent breakout narrative weakens quickly.
The Bollinger setup adds a subtle warning even while the trend stays positive. XOM is near the upper band at 169.65, with %B at 98%, meaning the price is hugging the top of its recent volatility envelope. In plain English, the stock is not just strong; it is stretched. The band width of 8.2% is still normal, so this is not a volatility explosion, but it does show that the move has already consumed much of the day’s available room.
Oscillators & Momentum
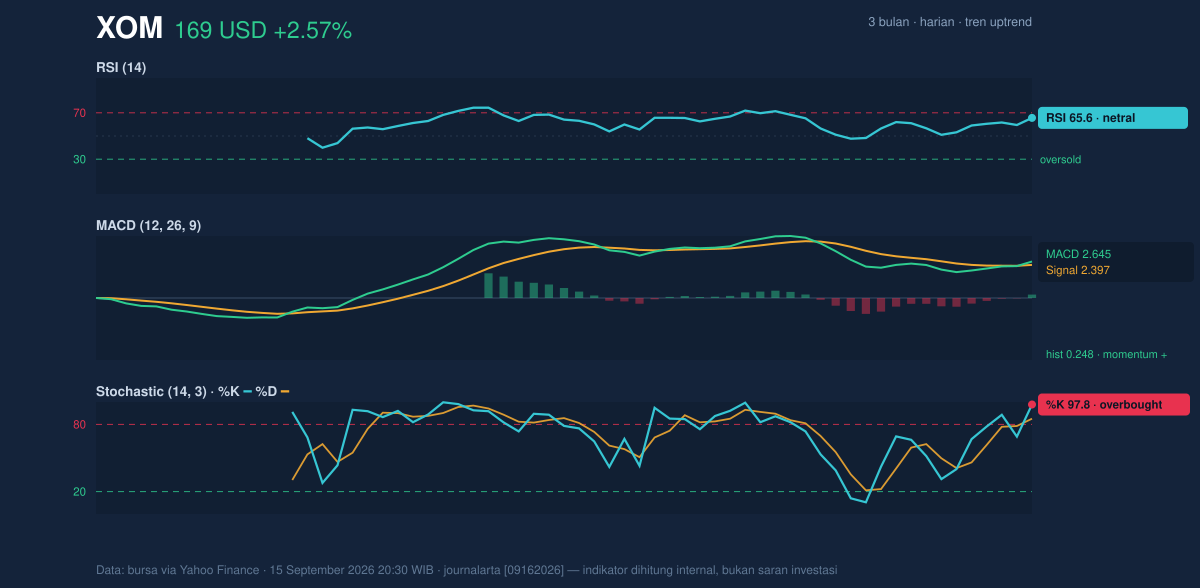
Momentum indicators are split in a way that often appears late in an advance. The RSI at 65.6 is still technically neutral, but it is close enough to the overbought zone to suggest the rally has become mature. That does not automatically mean reversal; it means the stock is no longer early in the move, and fresh upside may require continued volume or a clean break above resistance.
The stronger signal comes from stochastic, where %K at 97.8 and %D at 85.1 are both overbought. Stochastic tends to react faster than RSI, so when it is pinned this high, it often indicates the stock has moved quickly relative to its recent trading range. In practical terms, this is the market’s way of saying the stock may be running ahead of itself short term, even if the broader trend still points upward.
MACD, however, remains supportive. With MACD at 2.645 above the signal line at 2.397 and a positive histogram of 0.248, the trend-following momentum gauge still favors the bulls. That matters because MACD is less about short bursts and more about whether the trend has internal strength. Here, the answer is yes, but the gap is not huge, so momentum is positive rather than emphatically accelerating.
Volatility & Volume
The trading day was not especially energetic from a participation standpoint. Volume came in at 12,329,200, below the 20-hour average of 14,027,030, or about 0.9× normal. That combination is worth noting because price is rising while volume is lighter than usual. In market terms, it suggests the advance has not yet been backed by a broad surge in participation, which can make a breakout less convincing until more shares change hands.
Still, the OBV is rising, and that is a constructive background signal. On-balance volume tracks whether trading flow is accumulating or distributing over time, so a rising OBV alongside higher prices usually means the market has been adding to positions rather than unloading them. The message is not “all clear,” but it does indicate underlying demand remains intact.
ATR at 3.65, or 2.2% of price, points to moderate volatility. That is a useful frame for risk: XOM is moving enough to matter, but not so violently that the chart is behaving like a stress event. Combined with the normal Bollinger width, the setup suggests the stock may continue to trade in an orderly way unless a catalyst changes the pace.
Key Levels & Scenarios
The immediate technical battle is centered on the current high. Resistance at 169.32 is effectively being tested now, while the next visible ceiling is the 3-month high at 169.64. A sustained move through that zone would signal that the stock is not merely stretched but genuinely breaking higher within its recent range.
On the downside, support at 156.44 is the first level that matters. It sits close to the SMA20 at 162.97 and above the SMA50 at 156.39, so a drop toward that area would test whether the uptrend is still being defended by medium-term buyers. If price fails to hold that band, the market would likely interpret it as a loss of short-term momentum rather than a normal pause.
Technical Verdict: HOLD (wait & see)
HOLD (wait & see) — the trend is still positive, but the stock is stretched against resistance and momentum is overbought in the short term.
- Positive trend structure: price is above SMA20 and SMA50, with a rising SMA20 slope.
- Momentum remains constructive: MACD is above its signal line, but Stochastic is overbought, which often precedes consolidation.
- Price is at the top of the range: %B at 98% and price near 169.64 suggest limited room before the next decisive move.
- Verdict invalidated if price falls below 156.44, which would weaken the current support structure and challenge the short-term uptrend.
- Ideal entry range: 162.97 to 156.44
- Exit target: 169.64
- Stop loss protection: 156.30
For non-traders, this means the stock still looks strong, but it is already near a point where the market may pause before deciding whether to push higher or cool off.
Summary Data XOM
| Last price | 169.32 USD |
| Change 1 day / 5 days / 1 month | 2.57% / 5.39% / 4.87% |
| Trend / MA-cross | uptrend / none |
| SMA20 / SMA50 | 162.97 / 156.39 |
| RSI (14) / Stochastic %K | 65.6 / 97.8 |
| Bollinger %B / ATR | 98% / 3.65 |
| Support / Resistance 20 days | 156.44 / 169.32 |
| Data as of | 15 September 2026 20:30 WIB |

