DIS Stock Gains 0.54%, Momentum Weakens In Focus
On September 17, 2026: price 106.99 USD, trend sideways, RSI 53.7, support 104.18, resistance 111.25. technical analysis of dis stock. DIS Stock Gains — full…

Walt Disney shares ended at 106.99 USD, up 0.54% on the day, but the more important signal is that the stock is still trading below its 20-day average at 107.31 even after a 2.70% gain over five days and 2.92% over one month. That combination points to a market that is not in a clean breakout, but also not in retreat: buyers are active enough to keep the price near the middle of the recent range, while the broader structure remains sideways. For a stock like Disney, that usually means traders are waiting for a clearer catalyst rather than rewarding every small uptick.
Trend & Price Action
The chart shows Disney sitting between two different trend signals: price is below SMA20 at 107.31, which suggests the short-term recovery is still incomplete, while SMA50 at 102.41 sits well underneath, showing the medium-term base is still intact. In plain English, the stock has repaired some of its recent weakness, but it has not yet reclaimed the level that would tell the market the near-term tone has decisively improved. The absence of a new MA-cross matters here: there is no fresh moving-average confirmation to back up the latest bounce, so the move is more of a test than a verdict.
The Bollinger Bands reinforce that reading. With the middle band at 107.31, the upper band at 110.75 and the lower band at 103.88, Disney is hovering close to the center of its range, not stretched to either extreme. The %B at 45% says the price is slightly below the midpoint of the band structure, which is consistent with a market still searching for direction. More interesting is the 6.4% band width, described as a squeeze: when volatility compresses, it often signals the market is coiling for a larger move. That does not tell you direction on its own, but it does tell you the current calm may not last.
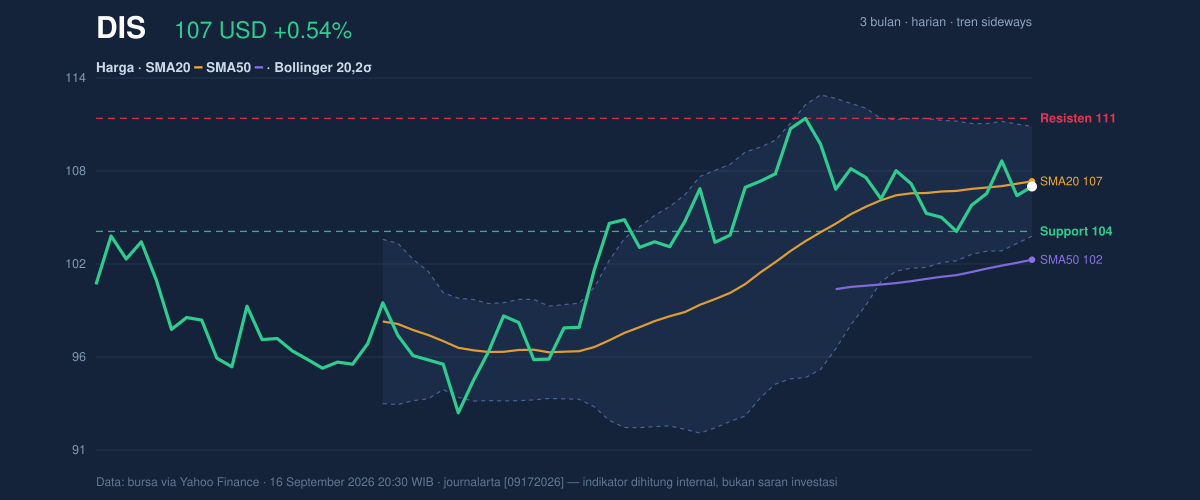
The stock is also trading at roughly 40% of its 20-session range, with 104.18 as nearby support and 111.25 as nearby resistance. That places Disney closer to the lower half of the range than the top, but not in danger territory. The three-month high at 111.87 is only slightly above resistance, which means the stock does not need a dramatic rerating to challenge recent peaks — it simply needs follow-through.
Short version: Disney is boxed in, but the box is tightening.
Oscillators & Momentum
Momentum is mixed rather than decisive. RSI at 53.7 is neutral, which means the stock is neither overbought nor oversold. That is important because it suggests the recent rise has not yet become crowded or exhausted. The Stochastic %K at 62.2 and %D at 55.8 also sit in neutral territory, with %K above %D, a modest sign that short-term momentum is leaning upward. But the signal is not strong enough to call a breakout on its own.
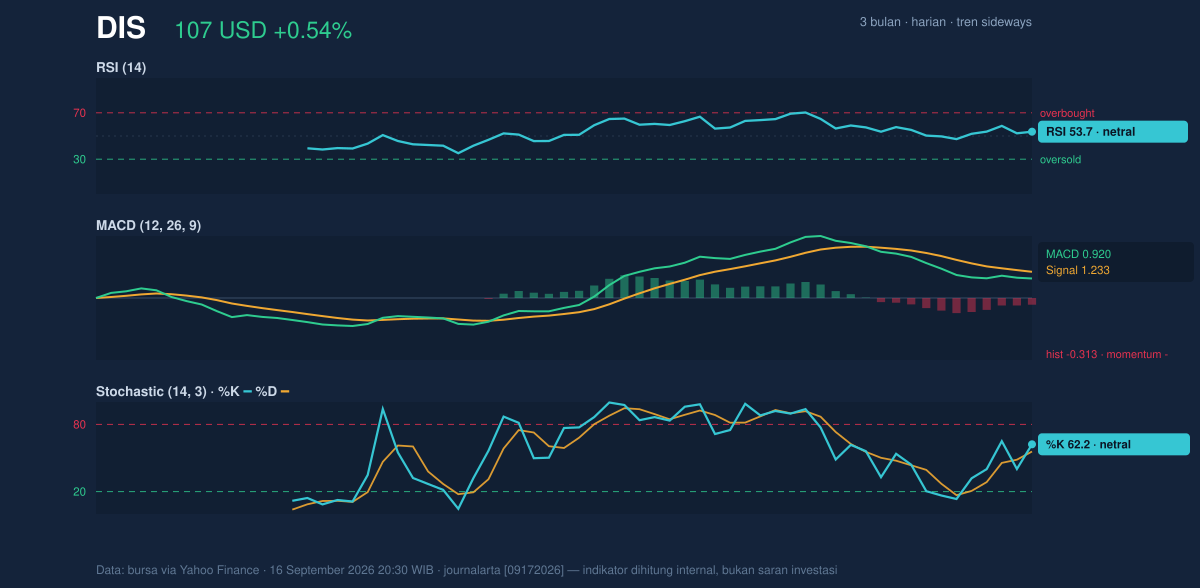
The more cautionary read comes from MACD. MACD at 0.920 is below the signal line at 1.233, and the histogram at -0.313 shows momentum is still negative. That matters because MACD is often used to judge whether a move has real internal strength. Here, the price has been improving, but the momentum engine has not fully caught up. In other words, the stock is climbing, but not with convincing acceleration. That is the classic setup for a range-bound name: price can rise, yet the underlying momentum still says “prove it.”
Volatility & Volume
Volume adds a constructive nuance. Disney traded 10,105,700 shares versus a 20-day average of 7,805,425, or about 1.3× normal. That tells us the latest move was not happening on thin participation. Combined with OBV rising — On-Balance Volume, a measure that tracks whether volume is flowing into up days or down days — the tape is showing accumulation rather than quiet drift. This is the kind of detail that can matter when momentum indicators are neutral: if volume is supporting the move, the stock has a better chance of resolving upward once resistance is tested.
At the same time, ATR(14) at 2.20, or 2.1% of price, says volatility is moderate. That fits the squeeze in the Bollinger Bands: the stock is not already swinging wildly, but it is close to a setup where movement could widen. The signal is less “dramatic trend” and more “compressed spring.”
Disney’s recent advance is being backed by participation, but the momentum still needs to catch up.
Key Levels & Scenarios
The nearest technical map is straightforward. 104.18 is the first support to watch; if that floor holds, the stock can continue to consolidate without damaging the current base. Above the market, 107.31 is the immediate pivot because it is both the 20-day average and the Bollinger middle band. A sustained move above that level would be the first sign that the short-term tone is improving. The next obstacle is 110.75, with the broader resistance at 111.25 and the 3-month high at 111.87 clustered nearby. That cluster matters because repeated failures there would tell the market the recent rally is running into supply.
If Disney cannot reclaim 107.31, the stock is likely to remain range-bound between support and resistance. If it clears 110.75 and then 111.25, the squeeze in volatility suggests the move could expand quickly. If it slips below 104.18, the current constructive base weakens and the market starts to revisit the lower end of the 3-month range.
Technical Verdict: HOLD (wait & see)
HOLD (wait & see) because the setup is balanced: the stock has positive short-term price action, but it is still below SMA20 at 107.31 and MACD remains negative, which prevents a clean bullish read. The case is supported by OBV rising and volume at 1.3× normal, showing participation is real, while the Bollinger squeeze hints that a larger move may be building. But the neutral RSI at 53.7 and neutral Stochastic say the market has not yet chosen a direction.
- Ideal Entry Range: 104.18 to 107.31
- Exit Target (Target Price): 110.75 to 111.25
- Stop Loss protection: below 104.18
Verdict invalidated if price falls below 104.18.
For non-traders: Disney is improving, but it still needs to prove the rebound is strong enough to leave the recent range behind.
“This is a market waiting for Disney to show its hand.”
Summary Data DIS
| Last price | 106.99 USD |
| Change 1 day / 5 days / 1 month | 0.54% / 2.70% / 2.92% |
| Trend / MA-cross | sideways / none |
| SMA20 / SMA50 | 107.31 / 102.41 |
| RSI (14) / Stochastic %K | 53.7 / 62.2 |
| Bollinger %B / ATR | 45% / 2.20 |
| Support / Resistance 20 days | 104.18 / 111.25 |
| Data as of | 16 September 2026 20:30 WIB |


