MRK Stock Analysis: Gains 0.78%, Testing Support Level
On September 17, 2026: price 144.91 USD, trend sideways, RSI 52.4, support 143.79, resistance 156.45. technical analysis of mrk stock. MRK Stock Analysis —…

Merck’s shares are trying to steady above recent lows even as the broader technical picture still leans cautious: the stock closed at 144.91 USD on the NYSE, up 0.78% from the previous close, but it remains below its short-term trend line and well under the upper half of its recent trading range. For international readers, the key question is whether this is a genuine base-building phase or just a pause inside a fading rebound.
Merck is one of the market’s classic defensive healthcare names, so its chart often matters less for drama than for what it says about institutional appetite. Right now, the signal is mixed: the stock is below SMA20 at 149.10 but still above SMA50 at 137.01, which usually means the medium-term structure has not broken, yet short-term momentum has slipped. That combination often shows a market that is still willing to own the shares on weakness, but not aggressively enough to reclaim the recent trend. The absence of a new MA-cross confirms there is no fresh trend reversal signal from the moving averages.
Trend & Price Action
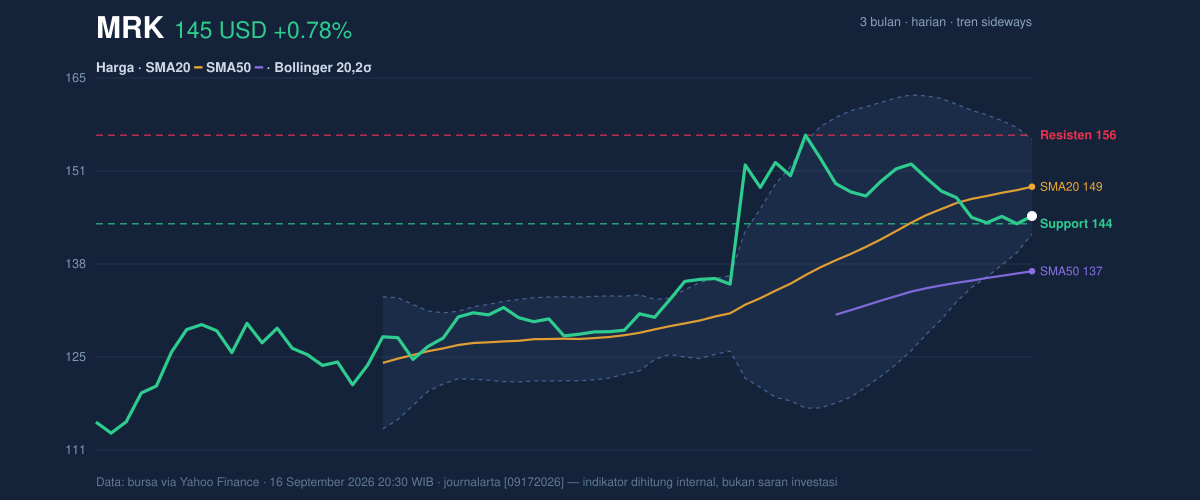
The chart shows Merck sitting in a sideways trend, with the SMA20 slope up 1.59% over 5 days, a sign that the recent bounce has not fully disappeared. But the price being below the 20-day average matters: in plain language, the stock has not yet convinced the market that the latest recovery is strong enough to retake control of the short-term tape. Merck is also trading at about 9% of its 20-hour range, using the provided support and resistance band, which places it closer to the lower end of that range than the midpoint. That positioning usually tells traders the market is still testing demand rather than breaking out.
The nearby floor is 143.79, while the immediate ceiling is 156.45. With the stock also sitting below the Bollinger middle band at 149.10, the message is that price is still below the area where the market has recently been comfortable transacting.
A clean move back above that middle band would matter.
Oscillators & Momentum
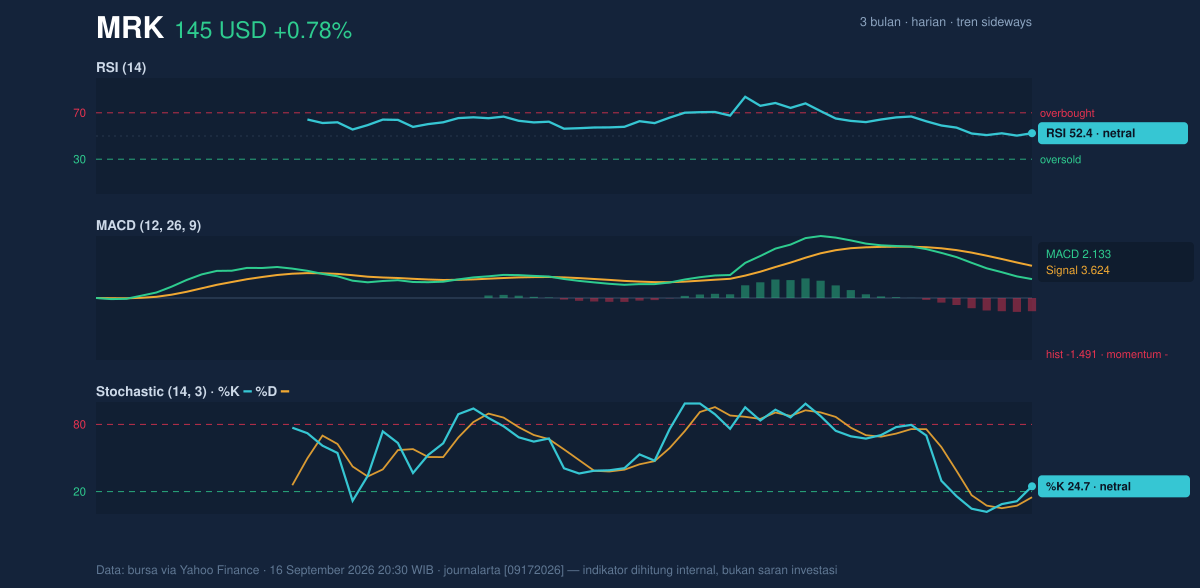
Momentum is not bearish enough to signal a breakdown, but it is not strong enough to confirm a durable advance either. The RSI at 52.4 is neutral, which means Merck is neither overbought nor oversold; in practical terms, the stock is not stretched in either direction. The Stochastic %K at 24.7 and %D at 15.0 also sit in neutral territory, though the low readings suggest the stock has recently been weak enough to cool off. That can be constructive if price stabilizes, but on its own it is not a buy signal.
The more important warning comes from MACD: MACD 2.133 is still below the signal line 3.624, leaving a histogram of -1.491. In chart language, that negative histogram means short-term momentum is still lagging the longer trend. It does not mean the stock is collapsing; it means the rebound is not yet powerful enough to outrun recent selling pressure.
That gap is the signal.
Volatility & Volume
The Bollinger setup is also telling. Merck is trading near the lower half of its band structure, with %B at 19%, which means the price is closer to the lower band than the upper band. The lower band sits at 142.34, so the stock is not far above a zone where volatility-based traders would expect support to matter. The 9.1% Bollinger width is described as normal, so this is not a squeeze setup that typically precedes a sharp expansion. Instead, it suggests the stock is moving within a fairly standard range, with no strong volatility compression to foreshadow an imminent breakout.
Volume is the other piece of the puzzle. Last trade volume was 7,226,900, only 0.7x the 20-hour average of 10,947,445, and OBV is down. OBV, or on-balance volume, tracks whether volume is broadly supporting price gains or losses. A falling OBV alongside a rebound attempt usually means the rally is not yet being confirmed by participation. In other words, the latest uptick looks more like a quiet bounce than a broad accumulation phase.
Key Levels & Scenarios
The chart leaves Merck in a narrow but important decision zone. 143.79 is the first support to watch, and it lines up closely with the lower Bollinger area at 142.34. If that zone holds, the stock could keep oscillating inside the current range while attempting to rebuild momentum. If it fails, the market would likely be signaling that the latest stabilization attempt has lost traction.
On the upside, 149.10 is the first technical hurdle because it is both the SMA20 and the Bollinger middle band. Above that, 156.45 becomes the key resistance, with the 3-month high at 156.92 sitting just above it. That cluster matters because it marks the area where the stock previously ran into supply. A move into that zone would indicate the market is willing to revisit the top end of the 3-month range, but it would still need volume confirmation to look convincing.
Technical Verdict: HOLD (wait & see)
HOLD (wait & see) — the chart is not broken, but it is also not strong enough to confirm a fresh upside phase.
- Reason 1: Price is below SMA20 at 149.10, which keeps short-term momentum capped.
- Reason 2: MACD is negative versus its signal line, showing momentum is still lagging.
- Reason 3: Volume is 0.7x normal and OBV is down, so the rebound lacks participation.
- Verdict invalidated if price breaks below 143.79, because that would weaken the nearby support and bring the lower Bollinger band at 142.34 into focus.
- Ideal Entry Range: 143.79 to 149.10
- Exit Target: 156.45 to 156.92
- Stop Loss protection: below 142.34
In plain English: Merck is holding together, but the chart still needs stronger confirmation before the rebound can be treated as durable.
The next technical checkpoint is whether the shares can reclaim 149.10 and then challenge 156.45, with the latest volume and OBV readings still arguing for patience rather than urgency.
Summary Data MRK
| Last price | 144.91 USD |
| Change 1 day / 5 days / 1 month | 0.78% / -1.78% / 7.21% |
| Trend / MA-cross | sideways / none |
| SMA20 / SMA50 | 149.10 / 137.01 |
| RSI (14) / Stochastic %K | 52.4 / 24.7 |
| Bollinger %B / ATR | 19% / 3.08 |
| Support / Resistance 20 days | 143.79 / 156.45 |
| Data as of | 16 September 2026 20:30 WIB |


