BP Stock Analysis: Drops 2.81%, Momentum Gains
On September 18, 2026: price 564.00 GBp, trend uptrend, RSI 61.1, support 514.50, resistance 580.30. technical analysis of bp stock. BP Stock Analysis — full…

BP plc is holding above its short- and medium-term trend lines, but the share price is still close enough to recent resistance that the market is asking whether the latest rally can extend further. That matters for international investors because BP sits at the intersection of energy prices, dividend expectations and a broader debate over how long oil majors can keep delivering cash while funding the transition.
BP.L last traded at 564.00 GBp on the London Stock Exchange, down 2.81% on the day from a previous close of 580.30, even after rising 1.24% over five days and 5.72% over one month. The message from the tape is not one of breakdown, but of a stock that has advanced into a crowded area of the chart and is now testing whether buyers still have conviction.
Trend & Price Action
The broader structure remains constructive. BP is trading above its SMA20 at 546.03 and above its SMA50 at 532.90, which is the classic sign that short-term momentum is still aligned with the medium-term trend. The uptrend label is reinforced by the SMA20 slope of 2.05% over five days, showing that the average price itself is still rising rather than flattening out.
There has been no fresh MA cross, so this is not a new trend signal; it is more a case of an established move still intact. In practical terms, that means the chart is being driven less by a sudden change in direction and more by whether the existing trend can absorb profit-taking near the top of the recent range.
As shown in the chart, BP is trading in the upper part of its recent band, with support at 514.50 and resistance at 580.30. The share price is sitting at roughly 75% of the range, which usually tells traders that the market is not cheap, but neither is it stretched enough to imply an immediate reversal on trend alone.
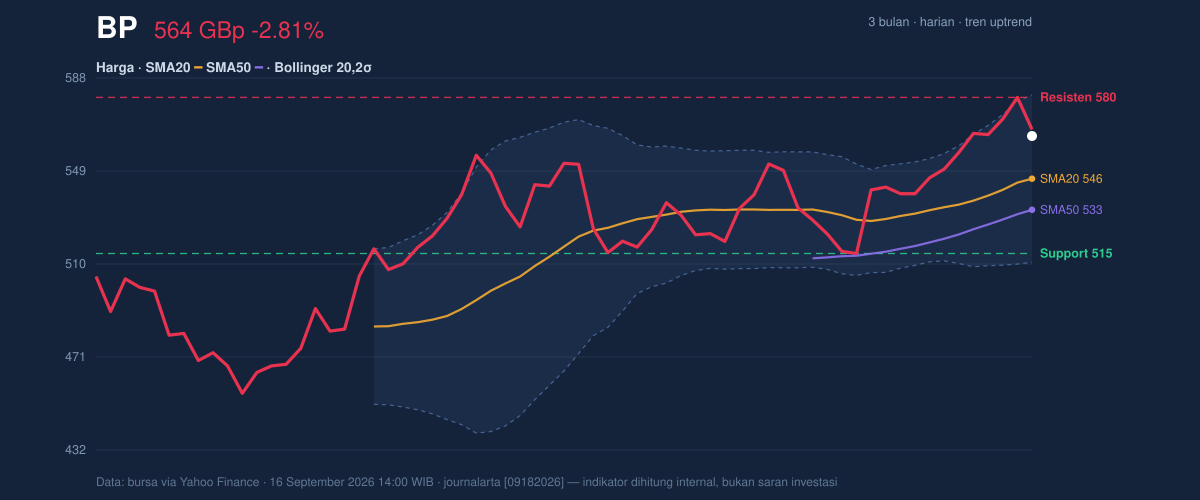
The wider three-month frame adds context: BP’s 3-month high is 582.60 and the 3-month low is 450.60. That places the current price much nearer the top of the recent trading corridor, so the next move is more likely to be defined by whether the stock can retest the high or slips back toward the mid-range.
Oscillators & Momentum
Momentum is positive, but not in a way that screams overheating. The RSI(14) at 61.1 sits in neutral territory, which usually means the market has room to run without being technically overbought. That is a healthier setup than an RSI in the 70s, where rallies often become more fragile.
The Stochastic %K at 77.4 and %D at 89.0 are higher, suggesting the stock is near the upper end of its recent short-term trading rhythm. For non-specialists, stochastic is a faster oscillator than RSI: when it rises high, it often signals that the price has moved quickly and may need either consolidation or fresh buying to continue higher. Here, it points to strength, but also to a market that may need a pause before another push.
The strongest momentum signal is the MACD at 11.660 versus a signal line at 8.515, leaving a positive histogram of 3.145. That combination matters because MACD is designed to show whether trend acceleration is improving or fading. In BP’s case, the histogram being above zero means upward momentum still exceeds the baseline trend, which supports the broader bullish structure even after the day’s pullback.
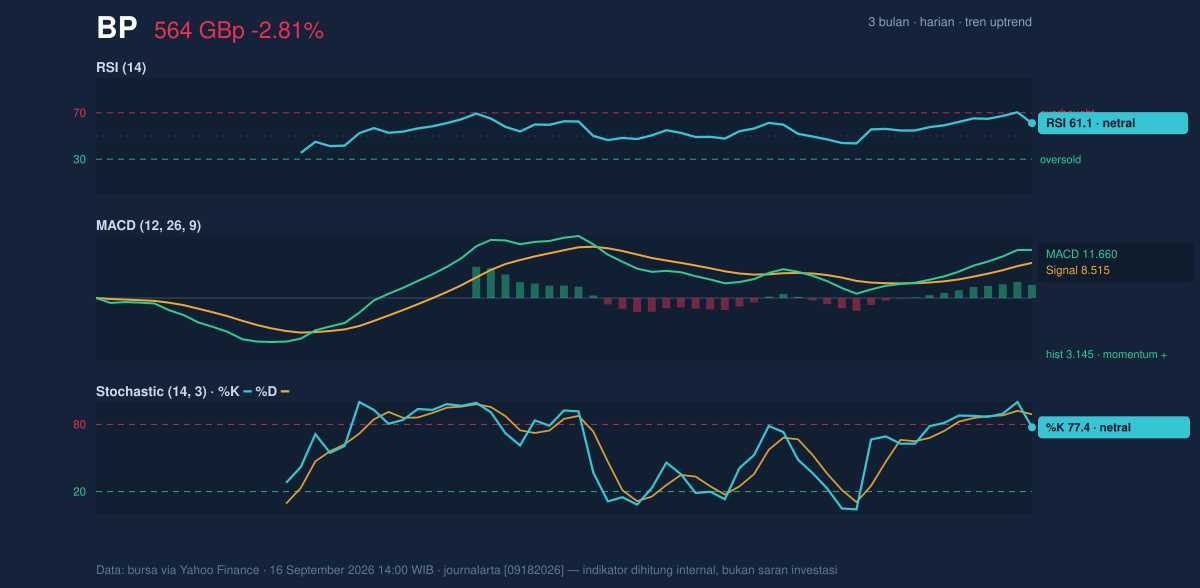
Taken together, the oscillators say BP is not overextended enough to rule out further gains, but it is close enough to the upper end of its recent move that momentum will need to stay supported rather than merely drift.
Volatility & Volume
Volatility is moderate rather than explosive. The ATR(14) at 16.72, equal to about 3.0% of price, indicates the stock can still move meaningfully in a session, but not in a disorderly fashion. The Bollinger Band width of 12.9% is described as normal, which argues against a volatility squeeze that might precede a sharp breakout. Instead, BP looks like a stock in a steady trend with ordinary day-to-day swings.
Position within the Bollinger structure is also important. The price is above the middle band at 546.03 and has room before the upper band at 581.33. The %B reading of 75% means BP is trading in the upper portion of its band, which confirms strength but also suggests the market is already pricing in a fair amount of optimism.
Volume does not yet provide a decisive breakout confirmation. Last volume was 42,482,288, slightly below the 20-day average of 44,908,265, or about 0.9x normal. That matters because rallies are usually more convincing when they are backed by heavier participation. The fact that OBV is rising is a helpful counterweight: on-balance volume tracks whether money is broadly flowing into the stock over time, and a rising OBV suggests accumulation is still present even if the latest session was not unusually busy.
Key Levels & Scenarios
The immediate battleground is clear. 580.30 is the first resistance to watch, and it sits just below the 3-month high of 582.60. A sustained move through that zone would signal that BP is not just holding its uptrend, but attempting to extend it into fresh territory within the current range.
On the downside, 546.03 is the first technical reference because it is both the SMA20 and the Bollinger middle band. If the stock loses that level, the market would be saying the short-term trend is losing momentum. Below that, 532.90 is the next important support because it is the SMA50, often treated by chart watchers as a line separating routine pullbacks from deeper trend damage. The broader floor remains 514.50.
Technical Verdict: HOLD (wait & see)
HOLD (wait & see) — the chart is still technically constructive, but BP is also trading near the top of its recent range, where upside follow-through needs stronger confirmation.
- Reason 1: Price remains above the SMA20 and SMA50, which keeps the trend positive.
- Reason 2: MACD is above its signal line with a positive histogram, so momentum is still supportive.
- Reason 3: RSI at 61.1 is not overbought, but Stochastic at 77.4 / 89.0 shows the stock is already near the upper end of its short-term range.
- Verdict invalidated if price falls below 546.03, because that would mean BP has lost its short-term trend anchor.
- Ideal Entry Range: 546.03 to 532.90
- Exit Target: 580.30 to 582.60
- Stop Loss protection: 514.50
For non-traders, this means BP still looks technically healthy, but the chart is asking for confirmation before the next leg higher.
The next market test is whether BP can reclaim 580.30 and challenge the 582.60 three-month high.
Summary Data BP
| Last price | 564.00 GBp |
| Change 1 day / 5 days / 1 month | -2.81% / 1.24% / 5.72% |
| Trend / MA-cross | uptrend / none |
| SMA20 / SMA50 | 546.03 / 532.90 |
| RSI (14) / Stochastic %K | 61.1 / 77.4 |
| Bollinger %B / ATR | 75% / 16.72 |
| Support / Resistance 20 days | 514.50 / 580.30 |
| Data as of | 16 September 2026 14:00 WIB |