Testing Key Resistance, AstraZeneca Stock Gains 2.58% Today
On September 18, 2026: price 12,428.00 GBp, trend sideways, RSI 51.8, support 11,650.00, resistance 12,476.00. technical analysis of astrazeneca stock.

According to data from the London Stock Exchange via Yahoo Finance, AstraZeneca (AZN.L) last changed hands at 12,428.00 GBp, up 2.58% on the day and now sitting just below a nearby ceiling that the chart shows at 12,476.00. That matters because the move is not happening in a vacuum: price is trading above SMA20 at 12,040.60 and also above SMA50 at 12,246.80, which tells readers the share price has recovered enough to sit on the stronger side of both short- and medium-term trend markers. The broader message from the tape is less about a clean breakout and more about pressure building inside a tight range, with volume and momentum now leaning in the same direction.
Trend & Price Action
The structure remains sideways, but it is a constructive sideways pattern rather than a drifting one. The slope of SMA20 at 0.68% over 5 days shows the short-term average is edging higher, which usually means buyers have been willing to pay up on dips instead of waiting for deeper weakness. Price is also positioned near the upper end of the recent band, at 94% of the 20-hour range, which signals that the market is spending more time near resistance than support. As shown in the chart, that placement is important because it often precedes either a breakout attempt or a brief pause while traders test whether the move has enough sponsorship to continue.
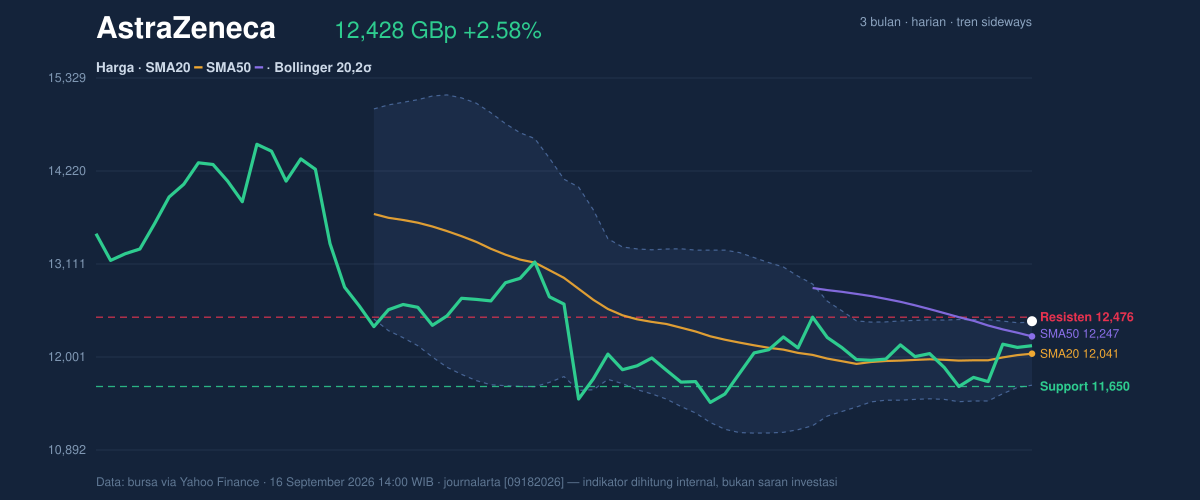
The key nuance is that AstraZeneca is not yet in a full trend breakout. There is no new MA cross, so the chart does not yet show a fresh long-term trend shift, even though the price is trading above the shorter averages. In plain language, the stock has improved, but the market has not delivered the kind of moving-average confirmation that would normally mark a decisive change in regime. That leaves the current setup balanced between continuation and hesitation.
Oscillators & Momentum
Momentum is better than the headline trend suggests. MACD at -71.389 remains below zero, which means the broader momentum picture is still technically negative, but the signal line at -114.564 is lower still, leaving a positive histogram of 43.175. For non-specialists, that combination means the down-momentum is fading and the stock is gaining internal strength, even if it has not fully crossed into outright bullish territory. The chart also shows RSI at 51.8, which is neutral and tells us the shares are not stretched. That is useful because neutral RSI leaves room for further upside without immediately triggering overbought concerns.
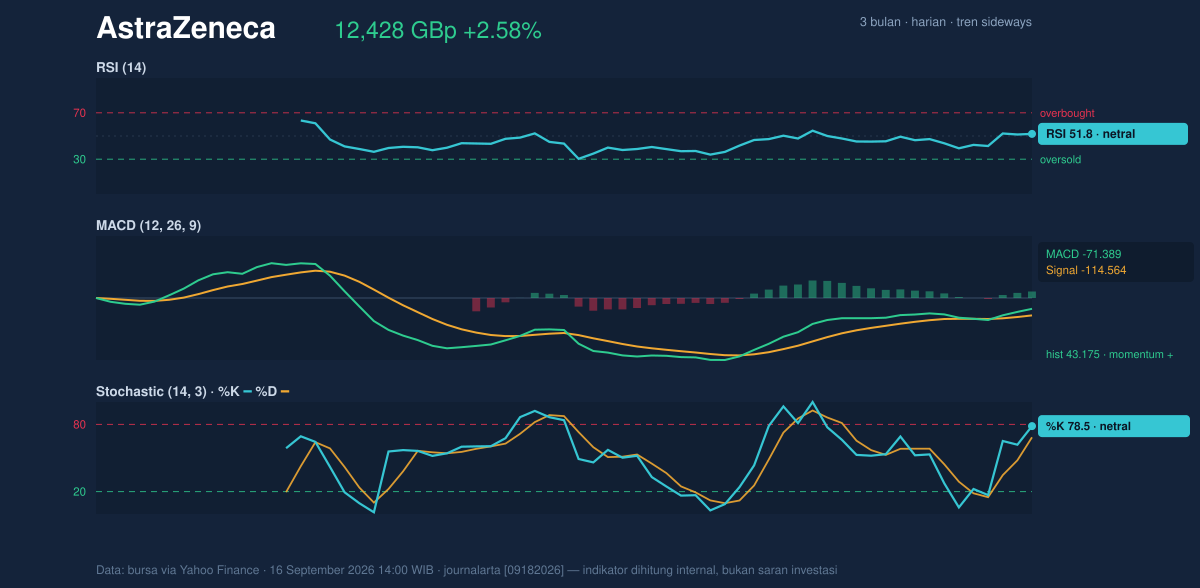
Stochastic %K at 78.5 and %D at 68.5 are more elevated than RSI, which suggests the stock is pressing into the upper part of its recent range. That does not automatically mean reversal, but it does mean buyers are no longer entering from a deeply discounted position. The signal is one of near-term strength with some caution: momentum is positive, yet not strong enough to erase the sideways character of the broader setup.
Volatility & Volume
The volatility backdrop is doing an important part of the work here. Bollinger Bands are tightening, with a 6.2% band width that points to a squeeze, or a period when price movement has compressed and a larger move can follow. The last price is also sitting at %B 102%, which means it is trading slightly above the upper Bollinger band at 12,416.02. In practical terms, that often signals strength, but it can also warn that the stock is temporarily extended relative to its recent range. The market is therefore showing a push through the top of the envelope, yet the narrow band width says the move still needs follow-through to prove itself.
Volume adds credibility to that push. Last traded volume of 5,327,145 was about 1.8× the 20-hour average of 2,950,854, and OBV is rising. OBV, or on-balance volume, is a simple way to track whether volume is flowing into a stock more often on up days than down days. A rising OBV alongside a volume burst usually means the move is being backed by participation rather than happening on thin trading. ATR at 305.32, or 2.5% of price, indicates volatility is moderate: there is enough movement to matter, but not so much that the chart is unstable.
Key Levels & Scenarios
The nearest technical map is clear. Support sits at 11,650.00, while resistance is 12,476.00. Because the price is already near the top of that band, the immediate question is whether AstraZeneca can turn resistance into a floor. If it does, the chart would likely shift from sideways to more decisively positive, especially with the rising volume and improving MACD histogram supporting the move. If it fails, the stock could slip back toward the middle of the band around the moving averages, where the market has already shown it is comfortable trading.
The broader 3-month range also frames the current move. The shares remain well below the 3-month high of 15,126.00 and comfortably above the 3-month low of 9,892.00, which reinforces the idea that this is a recovery phase inside a larger range rather than a runaway trend. That matters because range-bound stocks often need repeated confirmation before a breakout becomes durable. The current setup is encouraging, but still conditional on follow-through above the nearby ceiling.
Technical Verdict: HOLD (wait & see)
HOLD (wait & see) fits best because the chart is improving, but not enough to call a clean trend reversal.
- MACD histogram is positive, showing momentum is improving even though MACD remains below zero.
- Volume is 1.8× average and OBV is rising, which supports the latest upward push.
- Price is above SMA20 and SMA50, but there is no new MA cross and the broader trend is still sideways.
Verdict invalidated if price falls below 11,650.00, because that would break the nearest support and weaken the current recovery structure.
- Ideal Entry Range: 12,040.60 to 12,246.80
- Exit Target: 12,476.00
- Stop Loss protection: 11,650.00
In plain English: AstraZeneca is showing better short-term strength, but the chart still needs proof that it can hold above resistance.
Volume last traded at 5,327,145 shares versus a 20-hour average of 2,950,854.
Summary Data AstraZeneca
| Last price | 12,428.00 GBp |
| Change 1 day / 5 days / 1 month | 2.58% / 6.68% / 5.27% |
| Trend / MA-cross | sideways / none |
| SMA20 / SMA50 | 12,040.60 / 12,246.80 |
| RSI (14) / Stochastic %K | 51.8 / 78.5 |
| Bollinger %B / ATR | 102% / 305.32 |
| Support / Resistance 20 days | 11,650.00 / 12,476.00 |
| Data as of | 16 September 2026 14:00 WIB |