AstraZeneca RSI Overbought: Stock Gains 6.96% (October 30, 2026)
On October 30, 2026: price 13,960.00 GBp, trend uptrend, RSI 74.3, support 11,764.00, resistance 13,960.00. technical analysis of astrazeneca stock.

Why AstraZeneca is in focus today
- One-day move of 6.96%, about 2.7× its average daily range (ATR)
- Volume at 1.8× the 20-day average
- Closed at a 20-day high (13,960.00)
- Trading near its 3-month high (14,002.00)
- RSI(14) at 74.3 — overbought zone
- Uptrend confirmed (5-day change 8.86%)
Selected automatically from 98 LSE (UK) stocks by a technical-signal score with daily weighted randomisation — not a recommendation.
Trend & Price Action
The advance extends a strong run: AstraZeneca gained 8.86% over five days and 17.61% over one month. Its price is above both the 20-day simple moving average, at 12,502.30 GBp, and the 50-day average, at 12,307.28 GBp. The 20-day average rose 1.77% over five days, confirming an upward trend rather than a move driven only by the latest session. There was no new moving-average cross. The close sits above the upper Bollinger Band at 13,535.58 GBp, with %B at 121%. Bollinger Bands track price around a moving average; a reading above 100% means the price is beyond the band’s upper edge. That can reflect forceful buying, but it also warns that the share price has stretched beyond its recent statistical range. The band width of 16.5% is described as normal, so the move is not accompanied by an unusually compressed or expanding volatility band. As shown in the chart, the stock is at the top of its 20-day range and only 42.00 GBp below its three-month high of 14,002.00 GBp. The 20-day resistance is 13,960.00 GBp, while the 20-day support is 11,764.00 GBp. The chart also places the longer-term reference points and volatility bands alongside the price.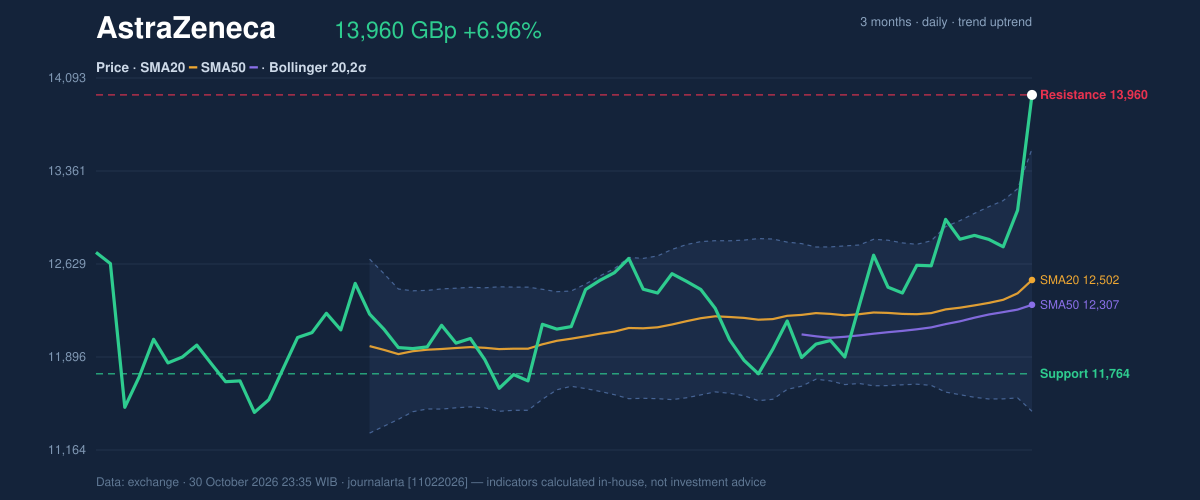
Oscillators & Momentum
The momentum readings confirm the strength of the advance, but they also underline the risk of a pause. The RSI is 74.3, in overbought territory. RSI compares the scale of recent gains and losses; readings above 70 are commonly treated as a sign that prices may have climbed quickly, not as proof that a reversal must follow. The Stochastic %K at 98.1 and %D at 90.4 are also overbought, reinforcing that caution. MACD points in the other direction: MACD is 285.150, above its 167.489 signal line, with a positive 117.660 histogram. This indicates that upward momentum remains positive, although it does not remove the possibility of a pullback after such a sharp rise. The chart shows the RSI, MACD and Stochastic readings together.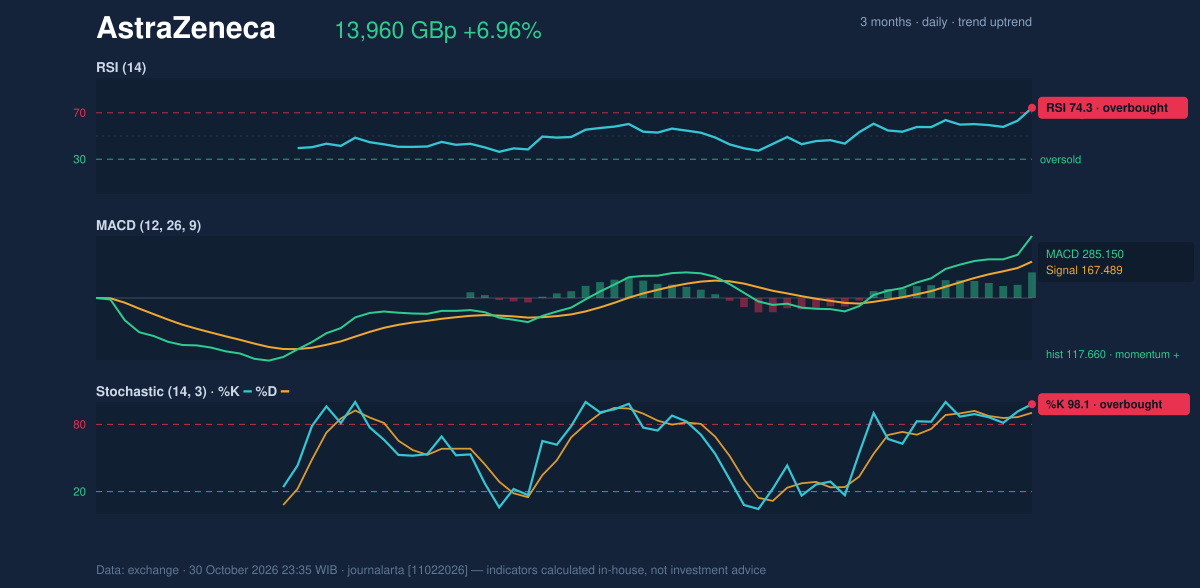
Volatility, Volume & Levels
The volume spike and rising On-Balance Volume (OBV) support the price move: OBV, a running measure that adds volume on rising sessions and subtracts it on falling ones, is increasing. That suggests participation is broadening rather than the advance occurring on thin trading. Still, the average true range (ATR) of 361.71 GBp, equal to 2.6% of the price, signals moderate day-to-day volatility. A session move of this scale can therefore leave room for sizeable swings. A sustained move above the three-month high of 14,002.00 GBp would extend the breakout beyond the current range. Failure to hold the upper-band breakout could instead bring the 13,535.58 GBp band back into focus; the deeper 20-day support is at 11,764.00 GBp. These levels frame possible scenarios, not guaranteed turning points.Technical Verdict: HOLD
The technical bias is neutral: two of seven signals are bullish and none are bearish, while several momentum measures have reached overbought territory. The core reading is a strong, volume-backed uptrend facing short-term exhaustion risk, which supports a wait-and-see verdict rather than a directional signal. - Ideal entry range: 13,535.58–13,960.00 GBp, using the upper Bollinger Band and 20-day resistance as reference levels. - Exit target: 14,002.00 GBp, the three-month high. - Stop-loss protection: 13,417.43 GBp, the price minus 1.5 times ATR reference. - Invalidation: The hold verdict is invalidated if the price falls below 11,764.00 GBp, the 20-day support. For non-traders, the indicators show a rising share price with strong trading interest, but enough signs of overheating to leave direction uncertain.| Session | Close | Daily change | Volume | Technical bias |
|---|---|---|---|---|
| Friday, October 30, 2026 | 13,960.00 GBp | +6.96% | 4,486,054 | Neutral |
Summary Data AstraZeneca
| Last price | 13,960.00 GBp |
| Change 1 day / 5 days / 1 month | 6.96% / 8.86% / 17.61% |
| Trend / MA-cross | uptrend / none |
| SMA20 / SMA50 | 12,502.30 / 12,307.28 |
| RSI (14) / Stochastic %K | 74.3 / 98.1 |
| Bollinger %B / ATR | 121% / 361.71 |
| Support / Resistance 20 days | 11,764.00 / 13,960.00 |
| Data as of | 30 October 2026 23:35 WIB |
Disclaimer: This technical analysis is generated automatically from exchange data and indicators calculated by JournalArta, for information and education only. The verdict and the entry, target and stop-loss levels are not investment advice or a solicitation to buy or sell any security. Investment decisions and their risks rest solely with the reader.
Track AstraZeneca share price daily: live levels, support/resistance and our full AstraZeneca analysis history.