Lloyds Stock Analysis: Drops 5.23%, RSI Oversold
On October 30, 2026: price 93.50 GBp, trend downtrend, RSI 30.0, support 93.50, resistance 105.85. technical analysis of lloyds stock. Lloyds Stock Analysis —…

Why Lloyds is in focus today
- Volume at 1.9× the 20-day average
- Closed at a 20-day low (93.50)
- Trading near its 3-month low (93.50)
- RSI(14) at 30.0 — oversold zone
- Downtrend extending (5-day change -7.10%)
Selected automatically from 98 LSE (UK) stocks by a technical-signal score with daily weighted randomisation — not a recommendation.
Trend & Price Action
Lloyds has fallen 7.10% over five days and 10.10% over one month, according to the supplied market data. The shares are below both the 20-day moving average of 102.40 pence and the 50-day average of 106.71 pence. The 20-day average itself declined 1.34% over five days, showing that the near-term trend is weakening rather than simply lagging a single down session. There is no new moving-average cross. Instead, price remains below both averages, a bearish structure in which rallies may encounter resistance from investors who bought at higher levels. Lloyds also finished at 93.50 pence, the low of its three-month range, leaving no lower reference within that recorded range. As shown in the chart, the share price has fallen below the lower Bollinger Band at 96.90 pence; the band’s middle line is 102.40 pence and its upper line is 107.90 pence. A close below the lower band can signal unusually forceful selling, although it is not by itself proof that the decline will continue. The technical-bias data identifies a squeeze resolving with a close below that band, adding to the downside signals.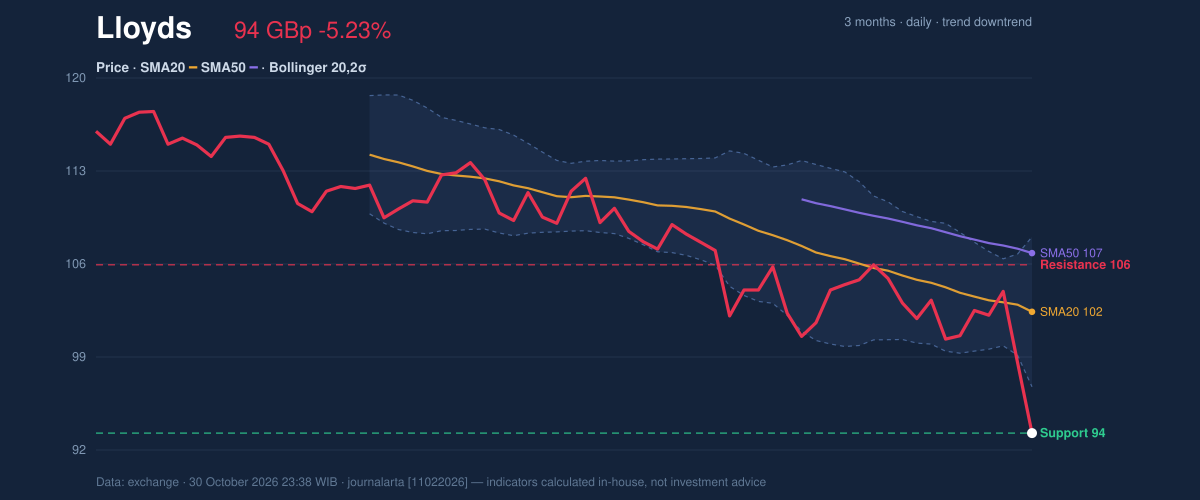
Oscillators & Momentum
The RSI is 30.0, in oversold territory, while the Stochastic readings—%K at 0.0 and %D at 7.8—are also oversold. These measures indicate that the recent decline has been steep relative to the shares’ recent trading pattern. They can precede a bounce, but oversold conditions can persist in a sustained downtrend; neither reading alone establishes that selling has ended. The MACD is negative at -2.271, below its signal line at -1.806, with a negative histogram of -0.465. That alignment indicates downside momentum remains in control. The technical-bias assessment also flags the histogram as having just turned negative, a further warning that momentum has deteriorated rather than improved.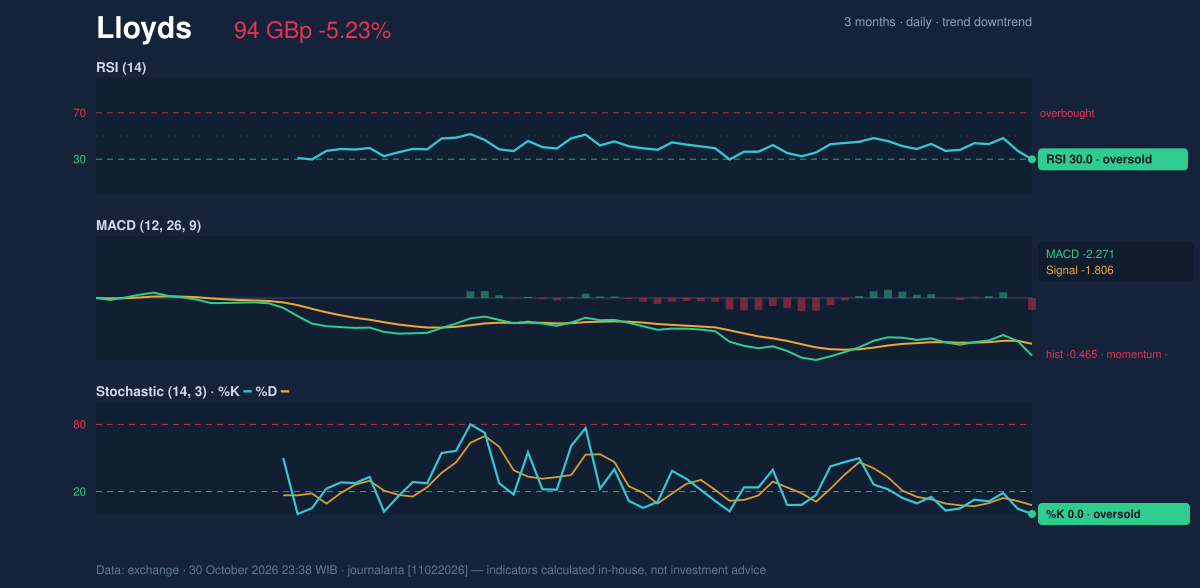
Volatility, Volume & Key Levels
Volume reached 298,608,707 shares, compared with a 20-day average of 156,835,508. That 1.9-times surge accompanied the lowest close in the 20-day range, while OBV—the indicator that tracks whether volume is accumulating on rising or falling days—was declining. Together, those signals suggest the sell-off had broad participation, rather than being driven by thin trading. The ATR is 4.21 pence, or 4.5% of the share price, indicating high volatility. ATR estimates the typical range of price movement; it does not predict direction. For context, the supplied reference levels place price minus 1.5 times ATR at 87.19 pence and price plus 1.5 times ATR at 99.81 pence. The immediate reference is support at 93.50 pence, which is also the three-month low. A sustained break below it would extend the decline beyond the recorded range and put 87.19 pence, the ATR-based reference, into focus. On any rebound, 99.81 pence is the corresponding upper ATR reference, while 105.85 pence marks 20-day resistance. The Bollinger Band’s lower edge at 96.90 pence is another near-term level to watch: recovering above it would ease the signal of an outside-band close, but would not by itself reverse the broader trend.Technical Verdict: SELL
The bearish verdict matches the supplied technical bias. The strongest signals are the close at the 20-day low on volume 1.9 times its average, negative MACD momentum, and falling OBV alongside a price below both moving averages. Oversold RSI and Stochastic readings are a counterweight, but do not yet show a confirmed turn. - Entry range: 93.50–99.81 pence, using the recorded support and the price-plus-1.5×ATR reference. - Exit target: 93.50 pence, the 20-day support and three-month low. - Stop-loss protection: above 105.85 pence, the 20-day resistance. - Invalidation: the bearish verdict is invalidated if price rises above 105.85 pence. In plain English, the indicators favour continued downside pressure, although oversold readings leave room for a volatile rebound. The shares closed at 93.50 pence on Friday, October 30.| Indicator | Reading |
|---|---|
| Price change | 1 day -5.23% | 5 days -7.10% | 1 month -10.10% |
| Moving averages | SMA20 102.40 pence | SMA50 106.71 pence |
| Momentum | RSI 30.0 | Stochastic %K 0.0 / %D 7.8 | MACD -2.271 |
| Volatility and volume | ATR 4.21 pence | volume 298,608,707 | OBV falling |
| Key levels | Support 93.50 pence | resistance 105.85 pence |
Summary Data Lloyds
| Last price | 93.50 GBp |
| Change 1 day / 5 days / 1 month | -5.23% / -7.10% / -10.10% |
| Trend / MA-cross | downtrend / none |
| SMA20 / SMA50 | 102.40 / 106.71 |
| RSI (14) / Stochastic %K | 30.0 / 0.0 |
| Bollinger %B / ATR | -31% / 4.21 |
| Support / Resistance 20 days | 93.50 / 105.85 |
| Data as of | 30 October 2026 23:38 WIB |
Disclaimer: This technical analysis is generated automatically from exchange data and indicators calculated by JournalArta, for information and education only. The verdict and the entry, target and stop-loss levels are not investment advice or a solicitation to buy or sell any security. Investment decisions and their risks rest solely with the reader.
Track Lloyds share price daily: live levels, support/resistance and our full Lloyds analysis history.