WPP Stock Gains 0.17% on Friday, Momentum Gains
On October 30, 2026: price 405.60 GBp, trend uptrend, RSI 58.6, support 372.30, resistance 412.70. technical analysis of wpp stock. WPP Stock Gains — full…
Why WPP is in focus today
- Volume at 1.6× the 20-day average
- MACD histogram has just turned positive
- Uptrend confirmed (5-day change 1.81%)
- Not covered by JournalArta in the last 14 days
Selected automatically from 98 LSE (UK) stocks by a technical-signal score with daily weighted randomisation — not a recommendation.
Trend & Price Action
WPP is trading above its 20-day simple moving average (SMA), at 392.03 GBp, and its 50-day average, at 385.32 GBp. An SMA smooths price movements to make the underlying direction easier to read. The 20-day average itself rose 1.02% over five days, reinforcing the upward trend; no new moving-average crossover was recorded in the latest session. The price has recovered above both averages, but is already in the upper portion of its recent range: it sits at 82% of the span between 20-day support at 372.30 GBp and resistance at 412.70 GBp. That positioning means buyers have momentum, but less room before reaching a near-term test. The three-month high of 420.17 GBp is the next larger reference if resistance gives way; the three-month low is 294.80 GBp. The chart places the price against its moving averages, Bollinger Bands and support and resistance levels.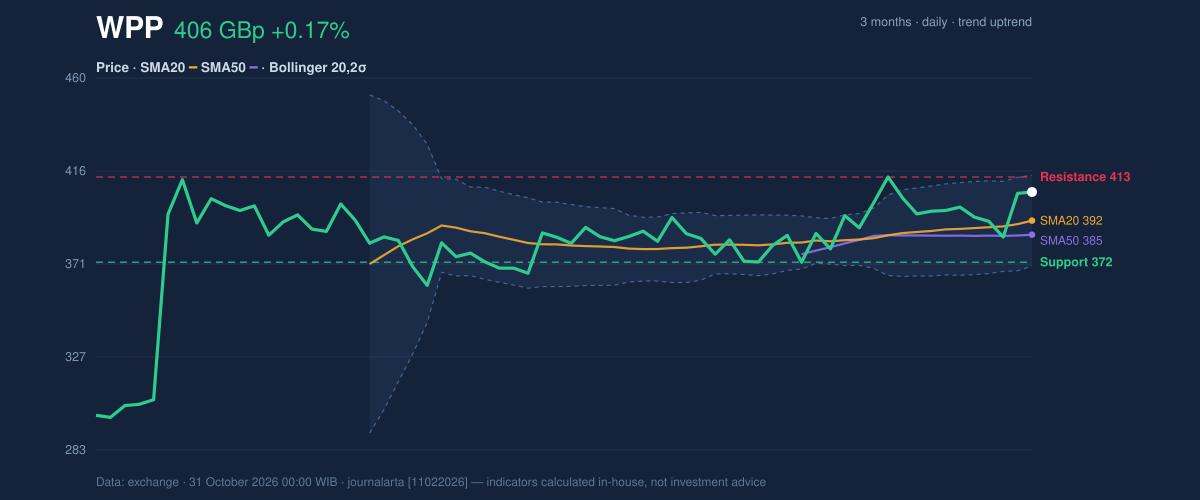
Oscillators & Momentum
Momentum indicators lean positive without showing an overheated market. RSI, a measure of the speed and scale of recent price moves, stands at 58.6, a neutral reading. The Stochastic readings are also neutral, with %K at 64.4 and %D at 48.1; the indicator compares the closing price with its recent range, and the gap between its lines points to improving short-term momentum rather than a decisive signal on its own. The MACD line is above its signal line, and its histogram is positive at 0.182. The histogram has just turned positive, a sign that upward momentum is gaining relative to the signal line. It adds confirmation to the price’s advance, but is not by itself proof that resistance will break. The chart shows RSI, MACD and Stochastic, helping place those neutral oscillator readings alongside the improving MACD signal.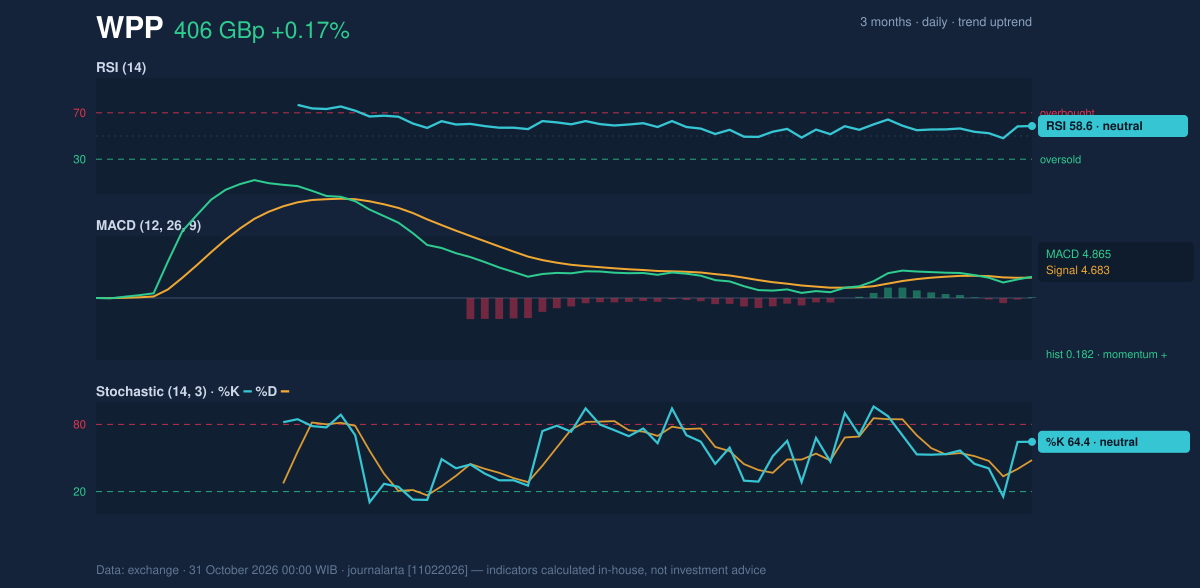
Volatility & Volume
Trading volume was 6,975,296 shares, compared with a 20-day average of 4,381,168. That 1.6-times surge gives the advance more weight than a rise on thin participation would carry. OBV, a running measure that adds volume on rising-price sessions and subtracts it on falling ones, is also rising—another sign that buying activity has been supporting the trend. The Bollinger Bands, which show price relative to a moving average and its recent variability, are at normal width rather than in a squeeze. WPP’s %B reading of 82% places the price toward the upper band, at 413.56 GBp, while the lower band is 370.49 GBp. This is consistent with strength, but also puts the price close to the band’s upper edge. Average true range (ATR), a measure of typical price movement, is 14.05 GBp, or 3.5% of the share price, indicating moderate volatility.Key Levels & Scenarios
The immediate test is 412.70 GBp, the 20-day resistance. A sustained break above it would bring the 420.17 GBp three-month high into focus. If the shares fail at resistance, the moving averages at 392.03 GBp and 385.32 GBp are closer reference points; the more substantial 20-day support is 372.30 GBp. These levels describe possible technical scenarios, not guaranteed turning points.Technical Verdict: BUY
The technical bias is bullish, supported by three of seven bullish signals and no bearish signals. The strongest evidence is the newly positive MACD histogram, the price holding above its 50-day average after a pullback toward the 20-day average, and rising OBV alongside above-average volume. The counterweight is proximity to resistance: the price is already at 82% of its 20-day range and near the upper Bollinger Band. - Ideal entry range: 392.03–405.60 GBp, anchored to the 20-day average and latest price. - Exit target: 412.70 GBp, the next 20-day resistance. - Stop-loss protection: 372.30 GBp, the 20-day support; a close below this level would invalidate the bullish verdict. The chart signals favour continued upward pressure, but the resistance at 412.70 GBp is the key test of whether the advance can extend. For non-traders, the indicators point upward, while the next resistance is close enough to make a pause or setback plausible. | Technical data | Reading | |---|---:| | Latest price | 405.60 GBp | | 1-day / 5-day / 1-month change | 0.17% / 1.81% / 8.83% | | SMA20 / SMA50 | 392.03 / 385.32 GBp | | RSI / Stochastic %K, %D | 58.6 / 64.4, 48.1 | | MACD histogram | 0.182, positive | | Bollinger upper / middle / lower | 413.56 / 392.03 / 370.49 GBp | | ATR (14) | 14.05 GBp | | Volume / 20-day average | 6,975,296 / 4,381,168 | | Support / resistance (20-day) | 372.30 / 412.70 GBp |Summary Data WPP
| Last price | 405.60 GBp |
| Change 1 day / 5 days / 1 month | 0.17% / 1.81% / 8.83% |
| Trend / MA-cross | uptrend / none |
| SMA20 / SMA50 | 392.03 / 385.32 |
| RSI (14) / Stochastic %K | 58.6 / 64.4 |
| Bollinger %B / ATR | 82% / 14.05 |
| Support / Resistance 20 days | 372.30 / 412.70 |
| Data as of | 31 October 2026 00:00 WIB |
Disclaimer: This technical analysis is generated automatically from exchange data and indicators calculated by JournalArta, for information and education only. The verdict and the entry, target and stop-loss levels are not investment advice or a solicitation to buy or sell any security. Investment decisions and their risks rest solely with the reader.
Track WPP share price daily: live levels, support/resistance and our full WPP analysis history.