British Land Stock Technicals: Gains 0.76% on Friday, Golden Cross Formed
On October 30, 2026: price 425.00 GBp, trend uptrend, RSI 62.8, support 384.80, resistance 425.00. technical analysis of british land stock.

Why British Land is in focus today
- Volume at 2.6× the 20-day average
- Closed at a 20-day high (425.00)
- Fresh golden cross: SMA20 crossed above SMA50
- Uptrend confirmed (5-day change 1.92%)
- Not covered by JournalArta in the last 14 days
Selected automatically from 98 LSE (UK) stocks by a technical-signal score with daily weighted randomisation — not a recommendation.
Trend & Price Action
Shares rose 0.76% in the session, 1.92% over five days and 9.14% over one month, according to the supplied market data. The price finished above both the 20-day average of 408.99 GBp and the 50-day average of 408.03 GBp. The 20-day average has risen 1.73% over five days, indicating that the shorter-term trend is strengthening rather than merely reflecting a single jump. The golden cross formed on the latest session: the 20-day average moved above the 50-day average. This crossover can signal that shorter-term momentum is improving relative to the longer trend, but it is a lagging measure, not a guarantee that gains will continue. Here, the accompanying volume and rising on-balance volume (OBV)—a measure that tracks whether volume generally supports price moves—provide additional confirmation. The stock is at 425.00 GBp, its 20-day resistance and the top of its 20-session range. That level is an immediate test: a sustained move beyond it would put the three-month high of 451.60 GBp in focus, while failure to hold the breakout area could prompt a retreat toward the moving averages.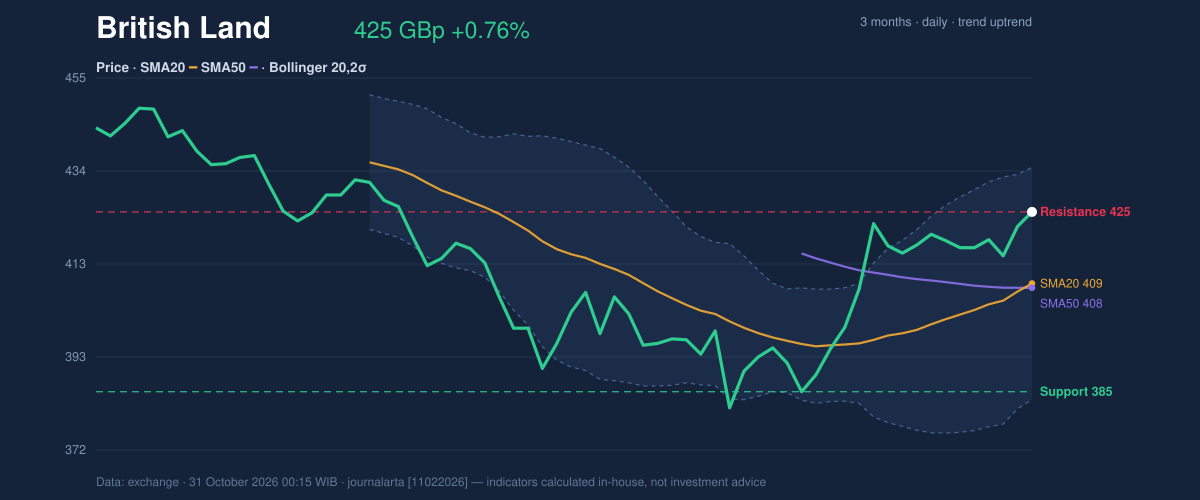
Oscillators & Momentum
Momentum readings are positive overall, but not unanimous. The MACD is above its signal line, with a positive histogram, a configuration consistent with upward momentum. The RSI at 62.8 is neutral: it points to strengthening demand without yet reaching the conventional overbought threshold. The caution comes from the stochastic oscillator. Its %K of 90.0 and %D of 82.3 are overbought, suggesting the recent advance has been rapid and could pause or pull back. An overbought reading alone does not establish a reversal; it means the price may be more vulnerable to short-term profit-taking, particularly near resistance.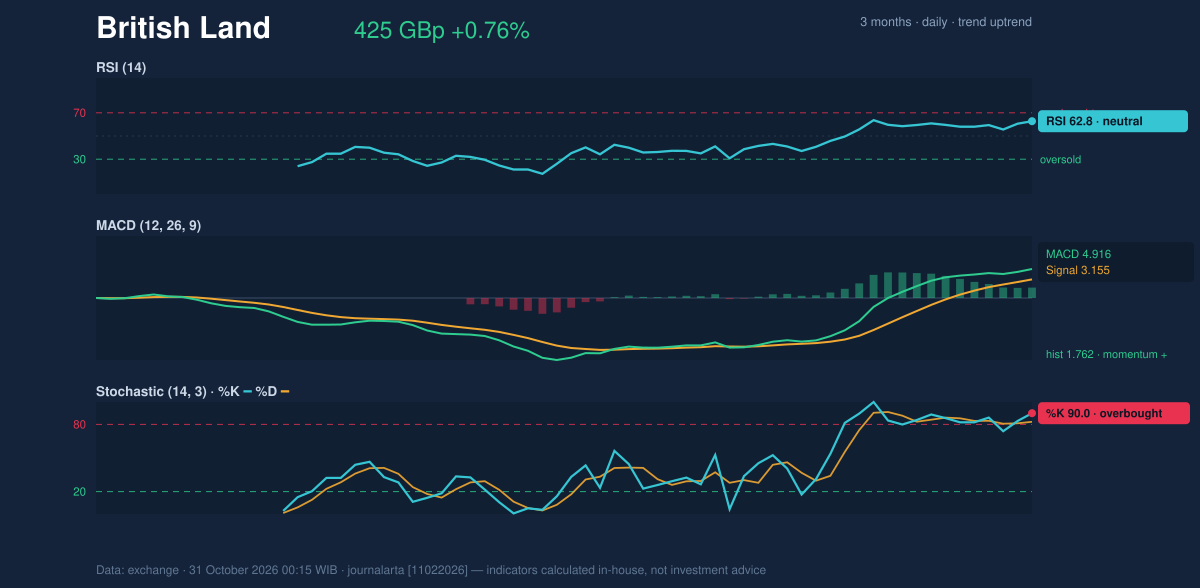
Volatility, Volume & Key Levels
Volume was 7,969,976 shares, or 2.6 times the 20-day average of 3,008,842. OBV is rising, strengthening the case that buyers participated in the move rather than price advancing on thin turnover. The technical-bias calculation also records three bullish signals and no bearish signals, including the latest-session crossover, the high-volume close at the 20-day high and rising OBV. The Bollinger reading is supportive but not extreme: price is at 81% of the band range, with the upper band at 434.96 GBp and the lower band at 383.02 GBp. The 12.7% band width is classified as normal, so the data do not show an unusually tight squeeze that might signal an impending volatility burst. Average true range is 9.63 GBp, or 2.3% of the share price, indicating moderate daily price variability. The main nearby reference points are 425.00 GBp resistance, 408.99 GBp for the 20-day average and 384.80 GBp support. The wider three-month range runs from 380.00 GBp to 451.60 GBp. A break above resistance would leave the three-month high as the next stated ceiling; a failure to hold the 20-day average would weaken the immediate trend, with the 20-day support marking a deeper test.Technical Verdict: BUY
The technical bias is bullish, matching the indicators: the latest-session golden cross points to improving trend structure; the high-volume close at the 20-day high, alongside rising OBV, confirms stronger participation; and MACD remains positive. The main counter-signal is the overbought stochastic, which raises the risk of a near-term pause. This verdict is invalidated if the price falls below 384.80 GBp, the 20-day support. - Ideal entry range: 408.99–425.00 GBp, between the 20-day average and 20-day resistance. - Exit target: 451.60 GBp, the three-month high, if price clears 425.00 GBp. - Stop-loss protection: 384.80 GBp, below the 20-day support. For non-traders, the indicators currently favour further strength, but the overbought reading means a pullback remains possible. The next technical test is whether British Land can hold above its 20-day high after Friday’s high-volume close.Summary Data British Land
| Last price | 425.00 GBp |
| Change 1 day / 5 days / 1 month | 0.76% / 1.92% / 9.14% |
| Trend / MA-cross | uptrend / golden |
| SMA20 / SMA50 | 408.99 / 408.03 |
| RSI (14) / Stochastic %K | 62.8 / 90.0 |
| Bollinger %B / ATR | 81% / 9.63 |
| Support / Resistance 20 days | 384.80 / 425.00 |
| Data as of | 31 October 2026 00:15 WIB |
Disclaimer: This technical analysis is generated automatically from exchange data and indicators calculated by JournalArta, for information and education only. The verdict and the entry, target and stop-loss levels are not investment advice or a solicitation to buy or sell any security. Investment decisions and their risks rest solely with the reader.
Track British Land share price daily: live levels, support/resistance and our full British Land analysis history.