Coca-Cola HBC Testing Key Resistance: Stock Gains 1.55% (October 30, 2026)
On October 30, 2026: price 4,704.00 GBp, trend sideways, RSI 66.5, support 4,236.00, resistance 4,704.00. technical analysis of coca-cola hbc stock.
Why Coca-Cola HBC is in focus today
- Closed at a 20-day high (4,704.00)
- Not covered by JournalArta in the last 14 days
Selected automatically from 98 LSE (UK) stocks by a technical-signal score with daily weighted randomisation — not a recommendation.
Trend & Price Action
The price stands above its 20-day simple moving average (SMA) of 4,456.00, while that average rose 2.04% over five days. The 50-day average is 4,468.20, slightly higher than the 20-day measure, and there has been no new moving-average crossover. In other words, price action has strengthened, but the averages have not produced a fresh trend-confirmation signal. The technical classification remains sideways. The close at the top of the 20-session range is constructive, yet it is not the same as a confirmed breakout: 4,704.00 is also the stated resistance level. The next higher reference is the three-month high of 5,090.00. As shown in the chart, the price has advanced toward the upper boundary of its recent structure, while its position relative to the averages and bands shows both recovery and limited room before nearby resistance.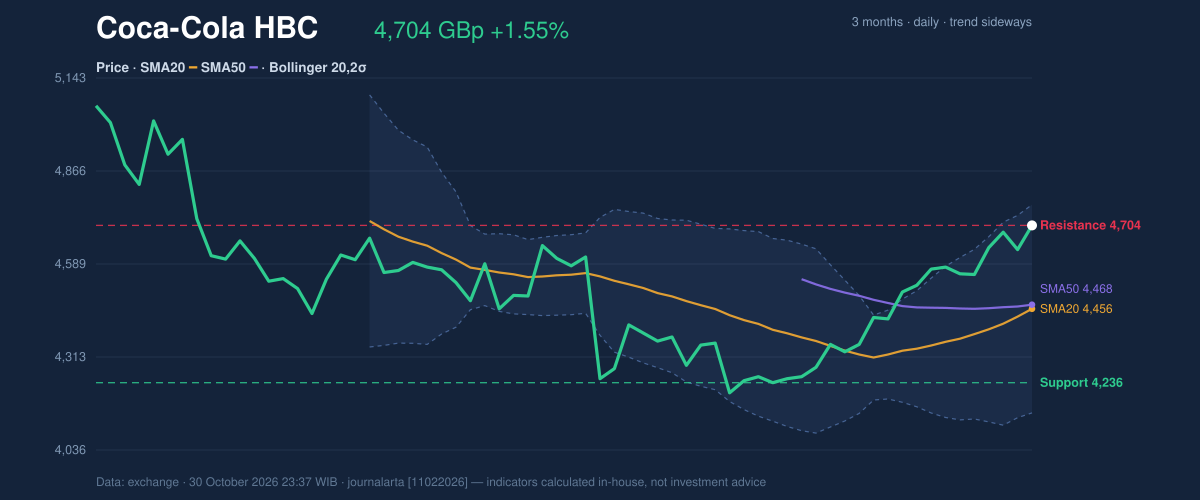
Oscillators & Momentum
Momentum indicators are positive, but not unanimous. The RSI is 66.5, classified as neutral, suggesting strength without a reading that the data labels overbought. By contrast, the Stochastic is overbought, with %K at 91.7 and %D at 89.4. Stochastic compares a recent close with its trading range; a high reading can signal that the advance has become stretched, though it does not by itself establish that a reversal has begun. The MACD is positive: its reading of 66.732 is above the 32.137 signal line, with a positive 34.595 histogram. That supports the view that upward momentum remains in place. The tension is therefore between positive MACD and a stretched stochastic, rather than a clear reversal signal. The combined readings point to a rally that has momentum but may need continued participation to extend.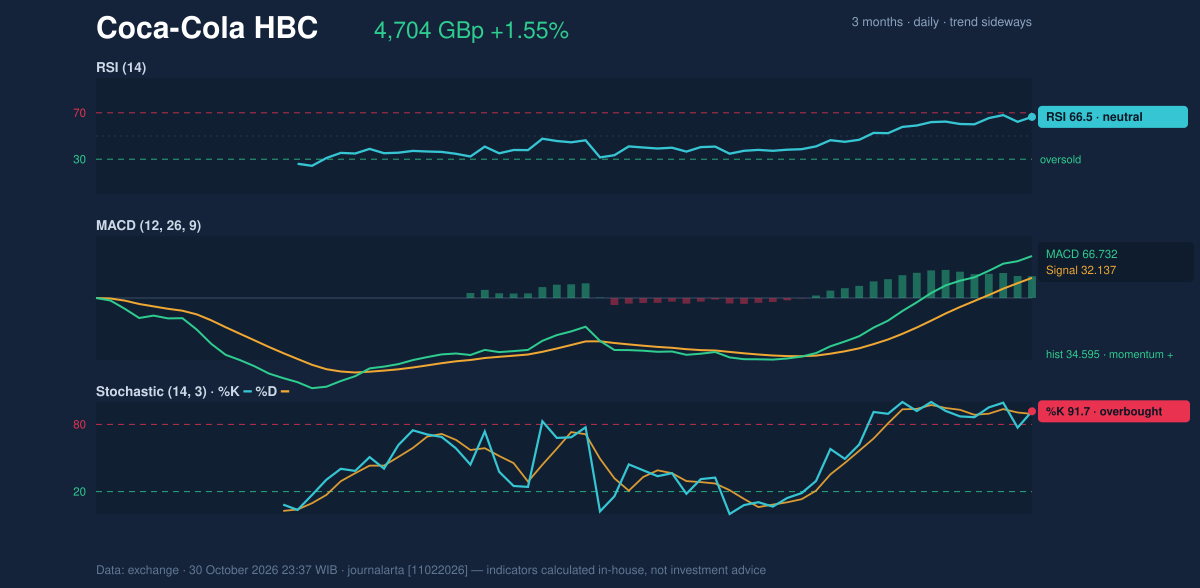
Volatility, Volume & Key Levels
The share price is near the upper Bollinger Band at 4,765.67, with %B at 90%. Bollinger Bands frame price against recent volatility; a high %B means the close is near the upper band, not that a breakout is assured. The band width of 13.9% is described as normal, so the data do not show an unusually tight range that might precede a volatility surge. ATR is 92.26, or 2.0% of the share price, indicating moderate daily movement. Participation is less convincing than price action. Volume was 499,996 shares, about 0.8 times the 20-session average of 659,509, while OBV rose. OBV tracks whether volume is associated with net buying or selling; its rise offers some confirmation, but below-average turnover means the latest move drew less trading activity than usual. The immediate test is resistance at 4,704.00. A sustained move above it would put the three-month high of 5,090.00 in view as the next major reference. If the price fails to hold its advance, the 20-day SMA at 4,456.00 and then 20-day support at 4,236.00 are relevant reference points; the three-month low is 4,205.92. The technical-bias model is neutral, with zero of seven bullish and zero of seven bearish signals, reinforcing that the data show competing conditions rather than a decisive directional setup.Technical Verdict: HOLD
HOLD (wait & see) is consistent with the neutral technical bias. The price is above its 20-day average and MACD momentum is positive, but the close is at resistance, stochastic is overbought, and volume is below its 20-session norm. Those signals do not yet align strongly enough to establish a confirmed directional move. - Ideal entry range: 4,456.00–4,704.00 GBp, bounded by the 20-day average and 20-day resistance. - Exit target: 5,090.00 GBp, the three-month high, if price clears the stated resistance. - Stop-loss reference: 4,236.00 GBp, the 20-day support. - Invalidation: the HOLD assessment is invalidated if price falls below 4,236.00 GBp. In plain English, the shares have momentum but are pressing resistance without strong volume confirmation.Summary Data Coca-Cola HBC
| Last price | 4,704.00 GBp |
| Change 1 day / 5 days / 1 month | 1.55% / 3.16% / 10.89% |
| Trend / MA-cross | sideways / none |
| SMA20 / SMA50 | 4,456.00 / 4,468.20 |
| RSI (14) / Stochastic %K | 66.5 / 91.7 |
| Bollinger %B / ATR | 90% / 92.26 |
| Support / Resistance 20 days | 4,236.00 / 4,704.00 |
| Data as of | 30 October 2026 23:37 WIB |
Disclaimer: This technical analysis is generated automatically from exchange data and indicators calculated by JournalArta, for information and education only. The verdict and the entry, target and stop-loss levels are not investment advice or a solicitation to buy or sell any security. Investment decisions and their risks rest solely with the reader.
Track Coca-Cola HBC share price daily: live levels, support/resistance and our full Coca-Cola HBC analysis history.