Momentum Weakens, HSBC Stock Gains 2.23% Today
On September 18, 2026: price 1,537.40 GBp, trend sideways, RSI 43.6, support 1,497.20, resistance 1,580.20. technical analysis of hsbc stock.

HSBC Holdings rose to 1,537.40 GBp on 16 September 2026 at 14:00 WIB, up 2.23% on the day and back above both its SMA20 at 1,533.71 and SMA50 at 1,526.51, but the move still sits inside a broader sideways pattern. That matters because a stock can trade above short-term averages and still lack conviction: here, the price is only modestly above the middle Bollinger band, momentum remains mixed, and volume is roughly normal rather than forceful. In other words, HSBC is improving tactically, but the chart has not yet shown the kind of broad participation that usually turns a rebound into a cleaner trend.
Trend & Price Action
As shown in the chart, HSBC is trading near the centre of its recent range, with the price at about 48% of the 20-hour range between support at 1,497.20 and resistance at 1,580.20. That positioning is important: it suggests neither buyers nor sellers have fully seized control. The stock is also still below the 3-month high of 1,610.00 and comfortably above the 3-month low of 1,350.00, which reinforces the idea of a market that has recovered from weakness but has not yet escaped consolidation.
The trend signal remains cautious. The stated trend is sideways, and the SMA20 slope of -0.02% over 5 days implies the short-term average is essentially flat, not decisively rising. That is a subtle but meaningful distinction: a flat moving average often marks balance, while a rising one would show more consistent accumulation. The fact that price is above both the 20-day and 50-day averages is constructive, but the lack of a fresh MA-cross means the chart has not produced a new trend-confirming signal.
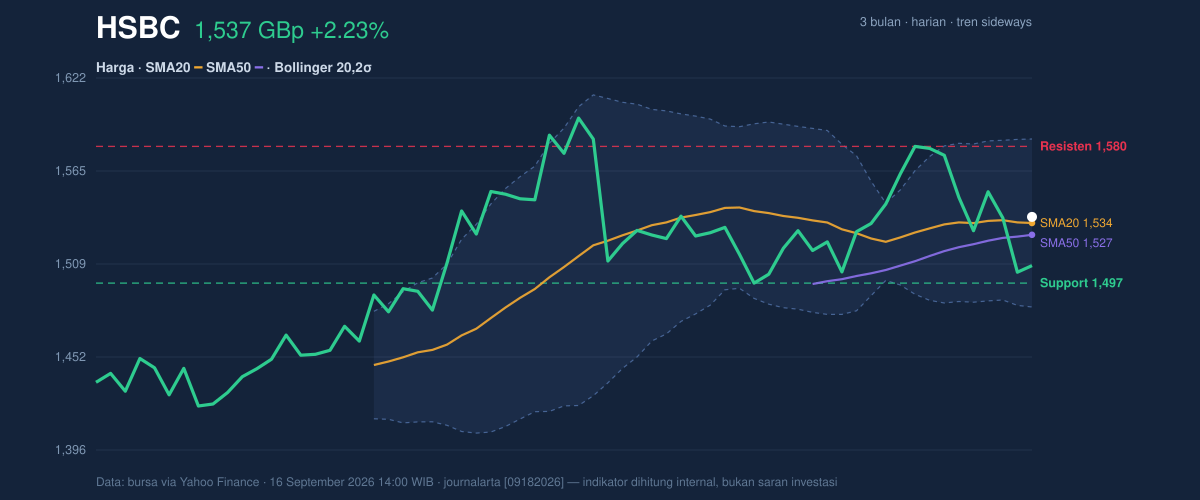
The Bollinger setup adds another layer. The bands are relatively tight, with a 6.6% width, and the description points to a squeeze — a compressed structure that often precedes a sharper move. Compression does not tell direction by itself, but it does tell us the market is storing energy. With %B at 54%, price is slightly above the mid-band at 1,533.71, which is a neutral-to-firm location rather than an overextended one. That combination suggests HSBC is not stretched; it is waiting for a catalyst or a decisive technical push.
Oscillators & Momentum
As shown in the chart, momentum is mixed rather than aligned. The RSI at 43.6 sits in neutral territory, which means the stock is neither overbought nor oversold on a conventional reading. But the Stochastic %K at 8.5 and %D at 18.3 are in oversold territory, signalling that recent selling pressure may be tired in the short run. That can support a bounce, yet it is not the same as a confirmed reversal. Oversold oscillators can stay low in weak markets, especially when broader momentum has not turned.
The more important warning comes from MACD. The MACD at 1.511 is below the signal line at 6.924, and the histogram at -5.413 shows negative momentum persists. Put simply, the trend-following indicator is still saying the recent price action lacks upside force. This is why the stock can look technically firmer on price alone while still failing to generate a full momentum confirmation. The chart is showing a rebound attempt, not a completed trend reversal.
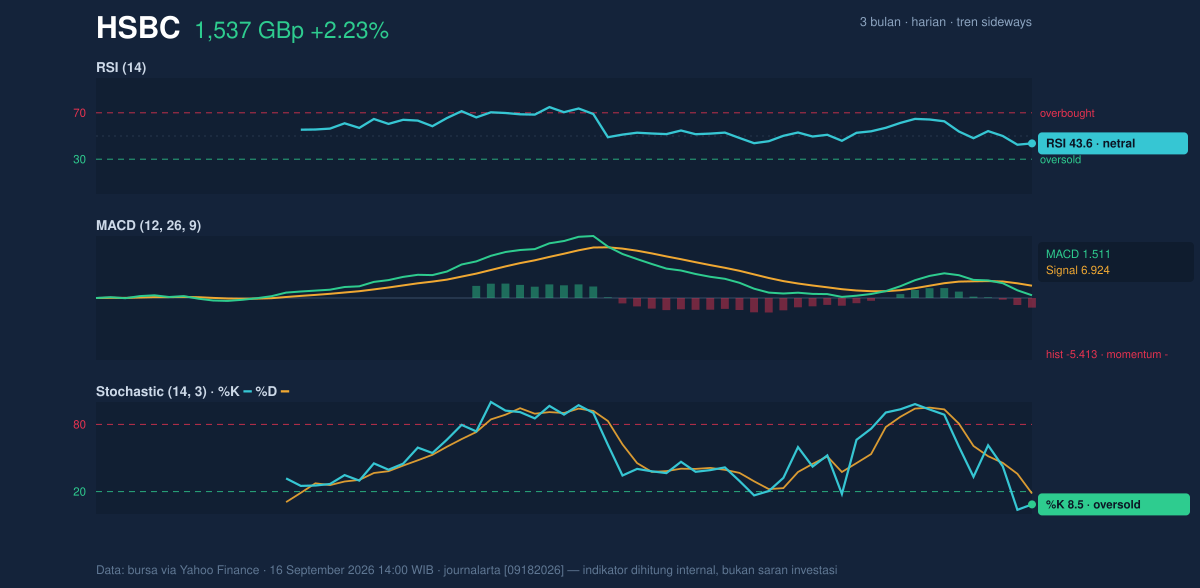
That tension between oversold stochastic readings and a negative MACD is the key technical story here. It often means the stock may be closer to a short-term floor than a breakout, but it also warns that any recovery could be choppy unless momentum improves alongside price. In plain language, the chart is not bearish enough to call a breakdown, but not strong enough to call a clean advance.
Volatility & Volume
Volatility is moderate, with ATR(14) at 29.65, equal to 1.9% of price. That gives a rough sense of daily movement potential: not calm, but not disorderly either. More importantly, the Bollinger squeeze suggests the next meaningful move could be larger than recent day-to-day swings. Traders often watch compressed volatility because it can precede expansion; the signal here is that HSBC may be building toward a wider range, though the direction still needs confirmation.
Volume does not yet provide that confirmation. Last volume was 17,355,843, close to the 20-hour average of 18,172,745, or about 1.0× normal. That is participation, but not urgency. The OBV is down, which is a notable divergence: on-balance volume tracks whether money flow is broadly supporting the trend, and a falling OBV while price steadies can mean rallies are not being fully backed by accumulation. That weakens the case for an immediate breakout above resistance.
Key Levels & Scenarios
The market is now boxed between support at 1,497.20 and resistance at 1,580.20. A move through resistance would matter because it would push price beyond the top of the recent range and closer to the 3-month high of 1,610.00. On the other hand, failure to hold support would expose the stock back toward the lower part of the range, where buyers previously reappeared. The middle Bollinger band at 1,533.71 is also important as a near-term pivot: staying above it keeps the rebound narrative alive, while slipping back below it would hand control back to sellers.
As shown in the chart, the most important signal is not the day’s gain itself, but whether price can convert a mild recovery into a range break with volume and momentum behind it.
Technical Verdict: HOLD (wait & see)
HOLD (wait & see) fits the current setup because the price is above the SMA20 and SMA50, but MACD remains negative, OBV is down, and the broader trend is still sideways. The Stochastic is oversold, which supports the case for a bounce, yet the signal is not strong enough to override the lack of momentum confirmation. The Bollinger squeeze suggests a larger move may be coming, but the direction is still unresolved.
- Ideal Entry Range: 1,533.71 to 1,497.20
- Exit Target (Target Price): 1,580.20, then 1,610.00
- Stop Loss protection: below 1,497.20
Verdict invalidated if price breaks below 1,497.20, because that would mean support has failed and the current rebound structure has lost its base.
For non-traders: HSBC is improving, but the chart still needs proof before the move can be treated as more than a short-term recovery.
Last volume: 17,355,843 shares versus a 20-hour average of 18,172,745.
Summary Data HSBC
| Last price | 1,537.40 GBp |
| Change 1 day / 5 days / 1 month | 2.23% / -0.76% / 1.51% |
| Trend / MA-cross | sideways / none |
| SMA20 / SMA50 | 1,533.71 / 1,526.51 |
| RSI (14) / Stochastic %K | 43.6 / 8.5 |
| Bollinger %B / ATR | 54% / 29.65 |
| Support / Resistance 20 days | 1,497.20 / 1,580.20 |
| Data as of | 16 September 2026 14:00 WIB |