CSCO Momentum Gains: Stock Gains 2.32% (September 18, 2026)
On September 18, 2026: price 110.24 USD, trend sideways, RSI 47.5, support 107.44, resistance 112.36. technical analysis of csco stock.

Cisco Systems shares rose to 110.24 USD on Nasdaq, up 2.32% from the previous close of 107.74, as trading pushed the stock back above its short-term average and toward the middle of a tightening range. The move matters less for its size than for its location: Cisco is now sitting just above the 20-day moving average, while the longer 50-day average remains higher, a combination that points to a market still searching for direction rather than one in a clean trend.
Trend & Price Action
As shown in the chart, Cisco is still in a sideways trend, and the slope of the SMA20 at -0.45% over 5 days shows the short-term path has not fully turned up. That negative slope is important because it tells readers the recent bounce is happening inside a broader pause, not after a confirmed trend reversal. The stock’s position above SMA20 at 110.01 is constructive, but it remains below SMA50 at 113.44, so medium-term momentum has yet to catch up with the latest price action.
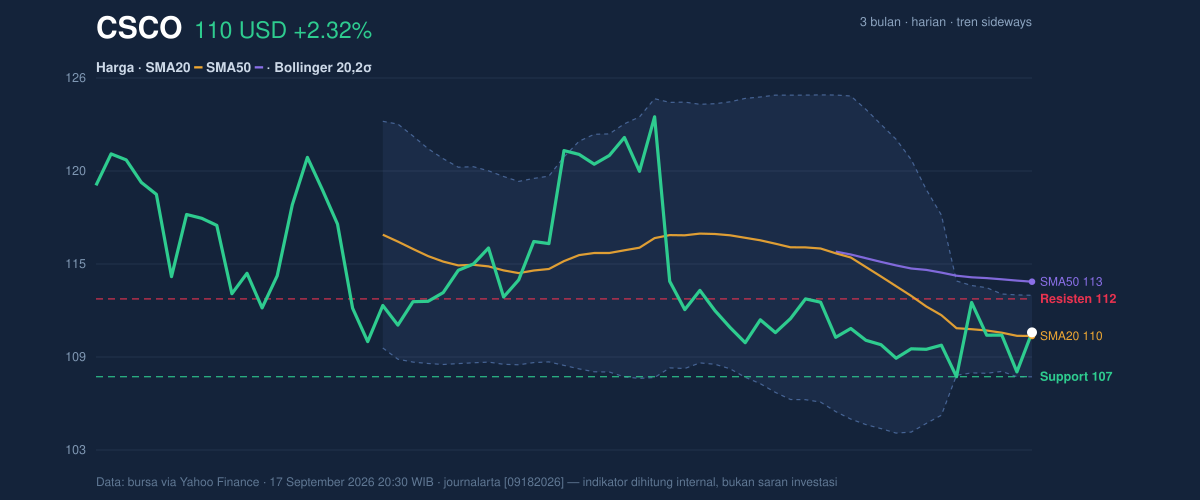
The Bollinger setup adds another layer. With the upper band at 112.59, the middle at 110.01, and the lower at 107.43, Cisco is trading near the center of its recent volatility envelope, with %B at 54%. In plain English, that means the stock is not stretched to either side of the band. More interesting is the 4.7% band width, which is narrow and suggests a squeeze — a period when price movement compresses before a larger break in one direction or the other. That does not predict the direction, but it does signal that the current calm may not last.
Oscillators & Momentum
Momentum indicators are not confirming a breakout yet, but they are also not warning of exhaustion. RSI at 47.5 is neutral, which means Cisco is neither overbought nor oversold and still has room to move either way. The Stochastic %K at 56.0 and %D at 37.3 also sit in neutral territory, though %K above %D suggests the short-term pulse is improving. That is a subtle but useful signal: buyers have gained a little ground, but not enough to call the move decisive.
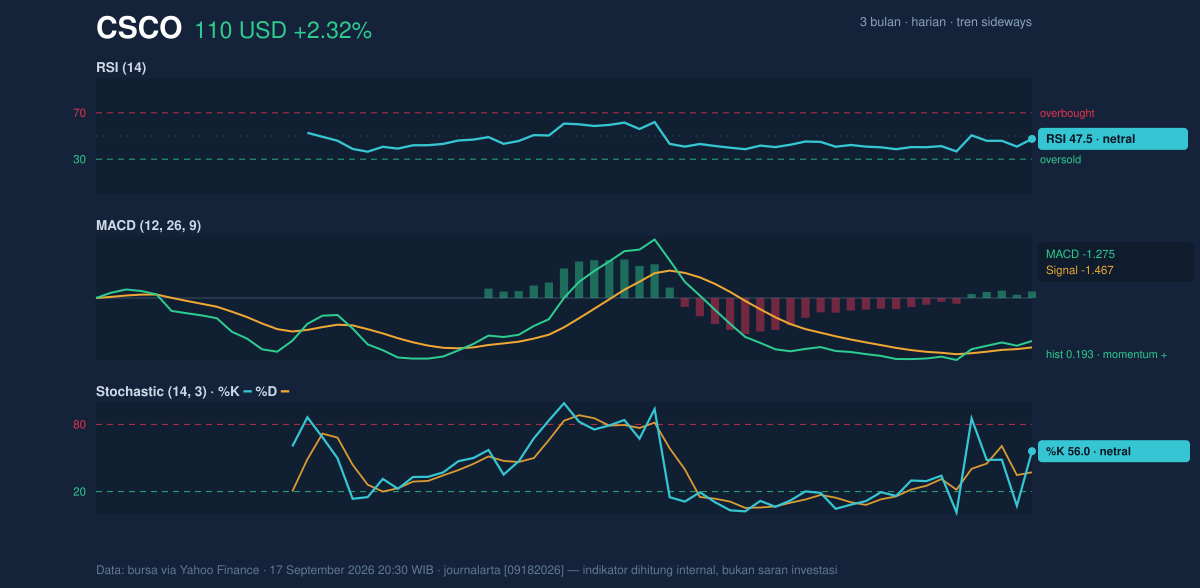
The more encouraging read comes from MACD. Cisco’s MACD at -1.275 remains below zero, so the broader momentum picture is not fully positive. But the signal line at -1.467 sits lower still, leaving a positive histogram of 0.193. That spread matters because it shows downward momentum is fading and the faster line is recovering relative to the slower one. In technical terms, the stock is trying to turn up from a weak base, though it has not yet crossed into a stronger trend regime.
Volatility & Volume
Volume gives the recent move more credibility. Trading at 16,153,200 shares versus a 20-session average of 13,821,680 means volume ran at about 1.2 times normal. That is not a frenzy, but it is enough to suggest the price move had participation rather than happening on thin trade. The OBV is rising, which is a constructive sign because on-balance volume tracks whether money flow is leaning into the stock over time. Rising OBV alongside price near the top half of the range often hints that accumulation is quietly improving.
Volatility is moderate. The ATR at 2.44, or 2.2% of price, indicates Cisco can still move meaningfully in a session, but not in a disorderly way. Combined with the Bollinger squeeze, that suggests the stock is coiled: not volatile in the moment, but capable of a wider swing if a catalyst or technical trigger appears.
Key Levels & Scenarios
The nearest support sits at 107.44, almost identical to the 3-month low of 107.36. That clustering is important because it marks a zone where buyers have already shown up before; if that area fails, the market would be signaling that the recent base is no longer holding. On the upside, 112.36 is the immediate resistance, just under the Bollinger upper band at 112.59. A move through that zone would not just be a routine uptick; it would indicate Cisco is escaping the current compression and testing whether the stock can extend beyond its recent ceiling.
The broader range still matters. Cisco’s 3-month high of 124.71 sits far above current trade, reminding readers that the stock is still well below its prior peak even after the recent bounce. At 110.24, price is positioned at about 57% of the 20-hour range, which fits the neutral-to-improving tone seen in the oscillators and volume. If price holds above 110.01 and challenges 112.36, the market would be showing that the short-term recovery is gaining traction. If it slips back below 107.44, the squeeze would likely resolve to the downside instead.
Technical Verdict: HOLD (wait & see)
HOLD (wait & see)
- RSI at 47.5 and Stochastic in neutral territory show momentum is improving but not yet decisive.
- MACD histogram at 0.193 is positive, which supports the bounce, but MACD remains below zero, so the larger trend is still unconfirmed.
- Price above SMA20 with a narrow Bollinger squeeze suggests a breakout may be forming, but direction is not yet established.
- Invalidation: this verdict is invalidated if price falls below 107.44.
- Ideal Entry Range: 110.01 to 107.44
- Exit Target: 112.36 to 112.59
- Stop Loss protection: below 107.44
In plain English: Cisco looks steadier than it did a few sessions ago, but the chart still needs confirmation before the next move can be trusted.
Summary Data CSCO
| Last price | 110.24 USD |
| Change 1 day / 5 days / 1 month | 2.32% / 2.61% / -0.28% |
| Trend / MA-cross | sideways / none |
| SMA20 / SMA50 | 110.01 / 113.44 |
| RSI (14) / Stochastic %K | 47.5 / 56.0 |
| Bollinger %B / ATR | 54% / 2.44 |
| Support / Resistance 20 days | 107.44 / 112.36 |
| Data as of | 17 September 2026 20:30 WIB |



