Death Cross Pressure, BAC Stock Gains 0.48% Today
On September 18, 2026: price 58.18 USD, trend downtrend, RSI 30.8, support 57.90, resistance 63.04. technical analysis of bac stock. Death Cross Pressure —…

Bank of America is trying to steady itself after a sharp slide, but the chart still says sellers have the upper hand. The stock finished at 58.18 USD on the NYSE, up 0.48% on the day, yet that modest bounce sits inside a broader pullback of -7.00% over five days and -7.90% over one month. For international readers, the key point is that BAC is not falling in a straight line, but it is still trading below the levels that usually signal a healthy trend.
Trend & Price Action
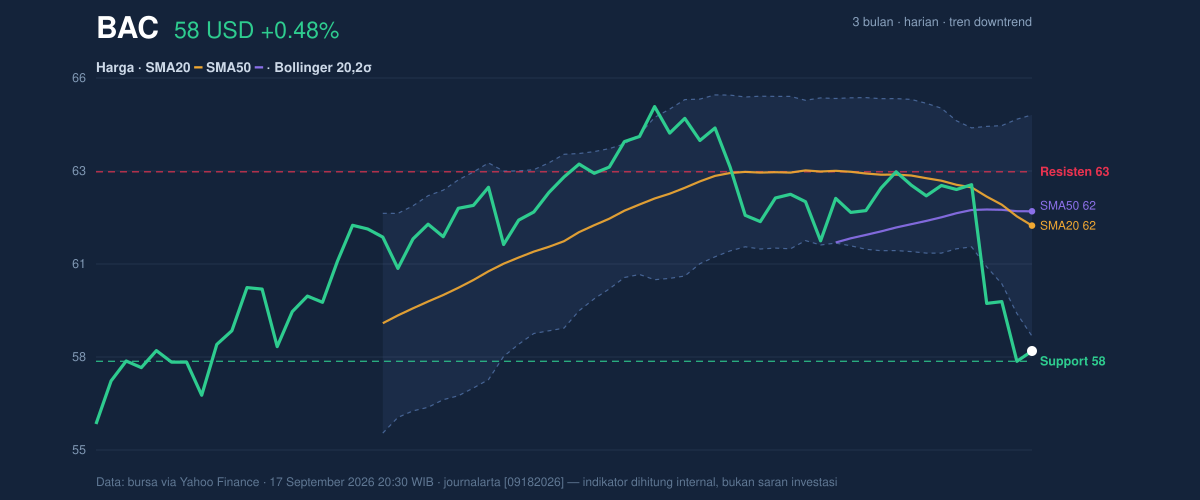
The most important signal is where price sits relative to its moving averages. BAC remains below the SMA20 at 61.58 and below the SMA50 at 61.97, while the chart also shows a death cross, meaning the shorter-term average has moved under the longer-term average. In plain language, that is a classic warning that recent momentum has weakened enough to overwhelm the prior trend. The SMA20 is sloping down by 1.76% over five days, which reinforces that the pressure is still directional rather than random.
The stock is also trading close to the lower end of its recent range. The 20-hour support at 57.90 is only a little below the last price, while the 20-hour resistance at 63.04 sits well overhead. The chart shows BAC at roughly 5% of the range, which means it is near the lower boundary rather than the midpoint. That positioning matters because markets often become fragile when price hovers near support after a multi-day drop: a small loss of footing can trigger another leg lower, while a bounce needs to reclaim nearby averages to prove it has substance.
The broader three-month range gives the same message. BAC has traded between 56.03 and 65.23, so the current price is much closer to the low than the high.
Oscillators & Momentum
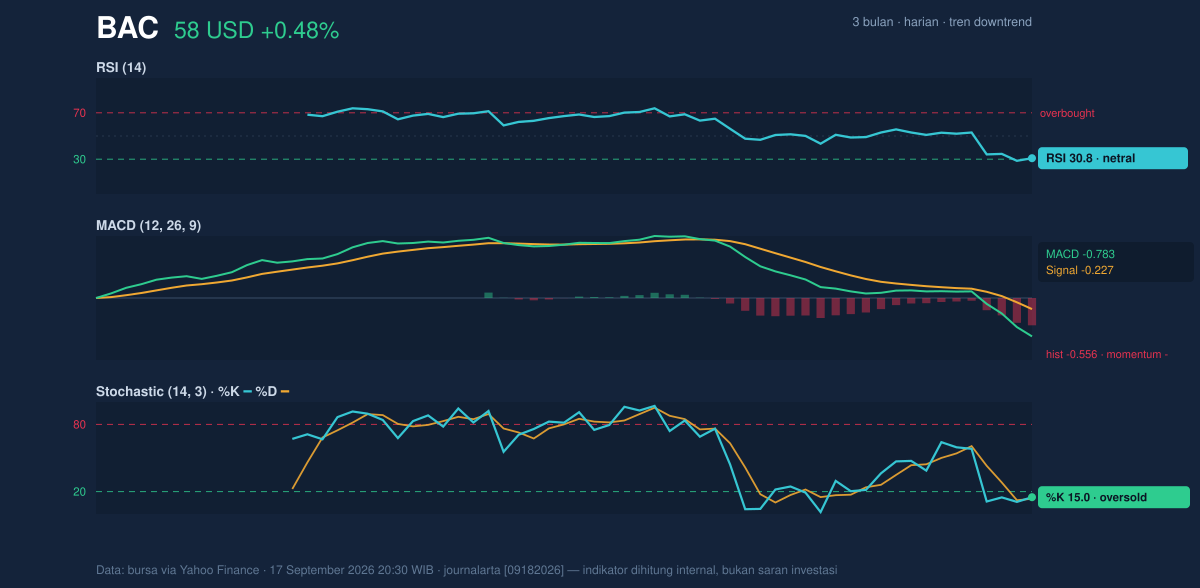
Momentum indicators are mixed, but not in a way that cancels the bearish trend. The RSI at 30.8 is technically near oversold territory, yet it is still described as neutral in the dataset. That combination usually means the stock has been sold enough to look stretched, but not so deeply that a reversal is confirmed. In other words, the market is tired, not healed.
The stochastics tell a slightly more urgent story. With %K at 15.0 and %D at 13.6, the oscillator is in oversold territory. This often appears when downside momentum has accelerated faster than the stock’s ability to recover. It can precede a bounce, but by itself it does not define one; oversold readings can persist in a downtrend, especially when the moving averages are still rolling over.
MACD is less forgiving. The MACD at -0.783, below the signal line at -0.227, with a histogram of -0.556, shows negative momentum still dominating. For readers unfamiliar with the indicator, MACD compares short- and medium-term trend strength; when it sits below the signal line, it suggests the recent pace of price movement remains weaker than the trend baseline. That is why the oversold stochastic does not yet outweigh the broader bearish structure.
Volatility & Volume
Volatility is present, but not extreme. The ATR at 1.41 equals 2.4% of price, which points to moderate volatility. That is important because it implies BAC can still move decisively in either direction without needing a market shock. The Bollinger Bands add another layer: the lower band is 58.58, the middle band is 61.58, and the upper band is 64.58. Since the stock is sitting slightly below the lower band with %B at -7%, price is stretched to the downside. In chart terms, that often marks a zone where selling may be overextended, but it also confirms that BAC has not yet regained the band structure associated with stabilization.
Volume has not delivered a strong reversal signal. Last volume was 36,718,400, just above the 35,160,000 20-hour average, or about 1.0x normal. That means the latest move was not supported by a dramatic surge in participation. More tellingly, OBV is falling, which suggests that on-balance participation still favors distribution rather than accumulation. When volume is normal but OBV is declining, rallies can struggle to build conviction because buyers are not yet proving they are in control.
Key Levels & Scenarios
The immediate line in the sand is 57.90. If BAC fails to hold that support, the chart opens the door to a retest of the 56.03 three-month low. That would confirm that the recent bounce attempt has not changed the underlying structure. On the upside, the first meaningful checkpoint is the 58.58 lower Bollinger Band, followed by the 61.58 SMA20 and Bollinger midline. A move back above those levels would matter because it would show the stock has recovered from oversold pressure and is beginning to repair trend damage. The more distant barrier is 63.04, the 20-hour resistance, which would need to give way before the chart could even start looking less defensive.
Technical Verdict: HOLD (wait & see)
HOLD (wait & see) fits the chart best because BAC is still in a downtrend, remains below the SMA20 and SMA50, and is marked by a death cross, yet momentum is also oversold enough to make the next move uncertain rather than one-sided.
- Reason 1: MACD is negative, so downside momentum has not clearly reversed.
- Reason 2: Stochastic is oversold, which raises bounce potential but does not confirm one.
- Reason 3: Price is below the lower Bollinger Band and near 57.90 support, so the setup is stretched but not repaired.
- Verdict invalidated if price falls below 57.90, because that would expose the 56.03 three-month low.
- Ideal Entry Range: 57.90 to 58.58
- Exit Target: 61.58, then 63.04
- Stop Loss protection: below 57.90, with the next risk reference at 56.03
In plain English: BAC looks stretched enough to bounce, but not strong enough yet to trust that the downtrend is over.
Summary Data BAC
| Last price | 58.18 USD |
| Change 1 day / 5 days / 1 month | 0.48% / -7.00% / -7.90% |
| Trend / MA-cross | downtrend / death |
| SMA20 / SMA50 | 61.58 / 61.97 |
| RSI (14) / Stochastic %K | 30.8 / 15.0 |
| Bollinger %B / ATR | -7% / 1.41 |
| Support / Resistance 20 days | 57.90 / 63.04 |
| Data as of | 17 September 2026 20:30 WIB |



