INTC Testing Key Resistance: Stock Gains 7.67% (September 18, 2026)
On September 18, 2026: price 108.80 USD, trend sideways, RSI 61.6, support 87.26, resistance 108.80. technical analysis of intc stock. INTC Testing Key…

Intel’s latest move puts the stock at the top of its recent trading range, a sign that momentum is still in charge even as short-term overheating risks rise.
Intel (NASDAQ: INTC) finished at 108.80, up 7.67% on the day and 17.24% over one month, according to exchange data cited by Yahoo Finance. That is a sharp improvement in tone for a name that has spent much of the recent period in a sideways pattern, but the technical picture is not a clean breakout story yet. The shares are now trading above both the SMA20 at 95.04 and the SMA50 at 97.17, which tells traders that the stock has moved back into a stronger short-term position. At the same time, the lack of a new MA cross suggests this is still an extension of recovery rather than a fully reset trend regime.
Trend & Price Action
The chart shows a stock that has pushed from the middle of its range to the upper edge very quickly. Intel is now sitting at 100% of its 20-hour range, with 20-hour support at 87.26 and 20-hour resistance at 108.80. That matters because when price reaches the top of a short-term range, the next move is often less about direction and more about whether buyers can keep absorbing supply after a strong run.
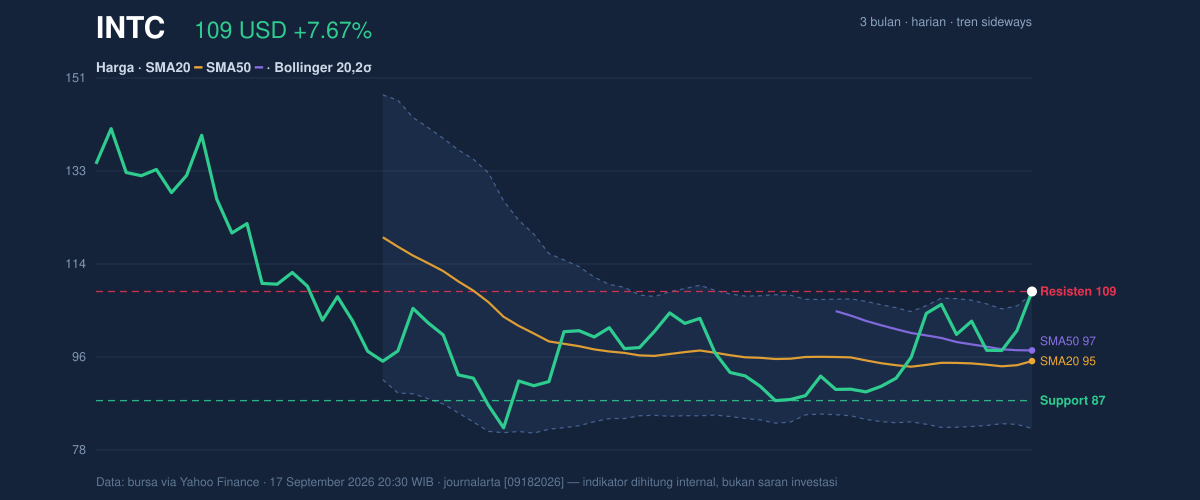
The broader context is still mixed. The shares remain below the 3-month high of 142.35, but well above the 3-month low of 81.79. That places the stock in the upper half of its recent three-month band without yet proving a lasting trend change. The sideways trend label, paired with a modest SMA20 slope of 0.37% over five days, suggests the moving averages are rising, but not with enough conviction to call the move mature. In plain terms, the stock is improving, but it has not yet settled into a steady upward channel.
Oscillators & Momentum
Momentum is the strongest part of the setup, but it is also where the first warning signs appear. The RSI at 61.6 is still neutral, which usually means the move has not yet reached a classic exhaustion zone. However, the Stochastic %K at 90.0 and %D at 72.6 are both in overbought territory, showing the stock is closing near recent highs and may be vulnerable to a pause if fresh buyers do not keep arriving. That combination often signals acceleration rather than calm accumulation.
The MACD at 1.420, above the signal line at -0.191, with a histogram of 1.611, is the clearest bullish confirmation in the data. MACD measures whether short-term price momentum is outrunning longer-term momentum, and here the spread is strongly positive. Put simply, the trend impulse is still pointing higher even if the oscillators are flashing that the move has become stretched.
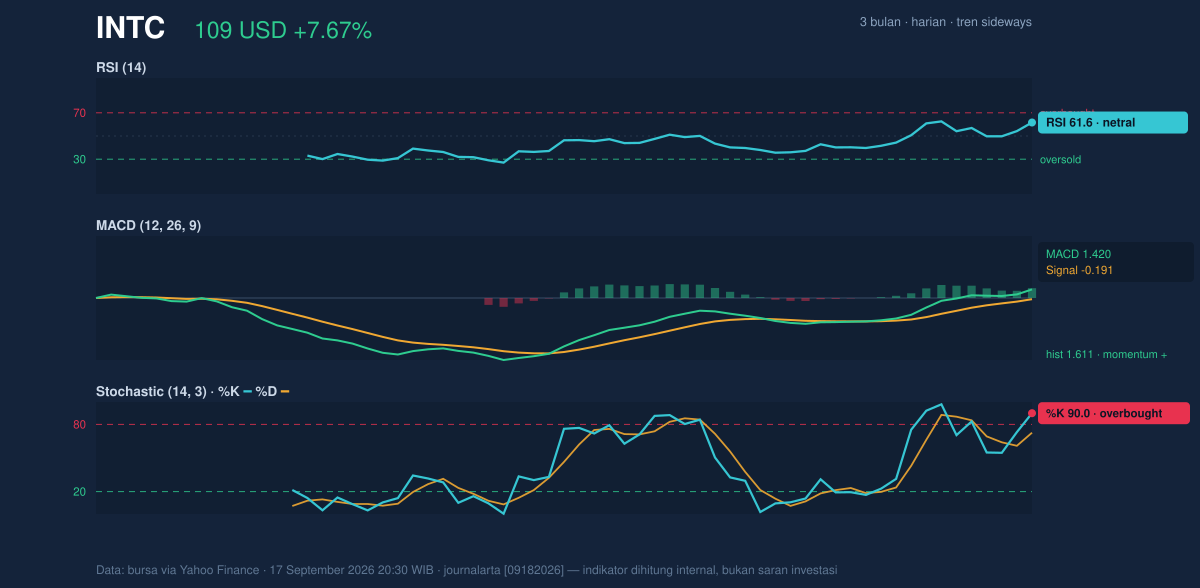
This is why the current setup looks more like a strong advance in a late phase than a quiet base-building phase. The momentum indicators are aligned enough to support the move, but not relaxed enough to suggest room has opened up without interruption.
Volatility & Volume
Volatility is also elevated. Bollinger Bands are widening, with the upper band at 108.31, the middle band at 95.04, and the lower band at 81.78. The %B reading of 102% means Intel is trading slightly beyond the upper band, which often happens when price is moving fast. That does not automatically mean reversal, but it does mean the stock is trading in a zone where mean reversion risk rises if momentum cools.
The 27.9% Bollinger band width confirms the market is no longer compressed. A squeeze, which often precedes a sharp move, has already given way to expansion, and expansion usually means larger swings in both directions. That is reinforced by the ATR at 5.64, or 5.2% of price, which points to a stock capable of moving materially in a single session. When ATR is this high, even healthy trends can retrace quickly.
Volume supports the advance. The latest volume of 148,929,100 is about 1.6× the 20-hour average of 93,410,050, and OBV is rising. That is important because rising volume and rising OBV indicate participation, not just a thin price jump. In technical terms, the move is being confirmed by money flow rather than drifting upward on weak turnover.
Key Levels & Scenarios
The immediate technical map is straightforward. 108.80 is both the latest price and the current short-term ceiling, while 108.31 on Bollinger and 108.80 on the 20-hour range show the stock is pressing against the top of its current structure. Below that, 95.04 is the first important pivot because it is the SMA20 and the Bollinger middle band. If price holds above that zone after a pullback, the rally would look more durable. If it slips through, the move starts to look more like a spike than a trend.
The deeper reference point is 87.26, the 20-hour support. A fall back toward that area would signal that the recent surge has lost traction and that the market is returning to the lower half of the range. The lower Bollinger band at 81.78 sits close to the 3-month low of 81.79, which makes that zone the market’s strongest downside reference in the data provided.
Technical Verdict: HOLD (wait & see)
Intel’s chart argues for HOLD (wait & see) because the trend is improving, but the move is already stretched into resistance territory.
- MACD is positive, showing momentum is still supportive.
- Volume is 1.6× average and OBV is rising, which confirms participation.
- Stochastic is overbought and %B is 102%, warning that price is extended at the top of its range.
Verdict invalidated if price breaks below 95.04, where the SMA20 and Bollinger midline sit.
- Ideal Entry Range: 95.04 to 97.17
- Exit Target: 108.80 to 108.31
- Stop Loss: 87.26
For non-traders, that means Intel is strong, but it is now close to a level where the stock may need to cool off before proving the move can continue.
Summary Data INTC
| Last price | 108.80 USD |
| Change 1 day / 5 days / 1 month | 7.67% / 8.45% / 17.24% |
| Trend / MA-cross | sideways / none |
| SMA20 / SMA50 | 95.04 / 97.17 |
| RSI (14) / Stochastic %K | 61.6 / 90.0 |
| Bollinger %B / ATR | 102% / 5.64 |
| Support / Resistance 20 days | 87.26 / 108.80 |
| Data as of | 17 September 2026 20:30 WIB |


