Momentum Weakens, China Unicom Stock Gains 2.11% on Monday
On November 2, 2026: price 5.32 HKD, trend downtrend, RSI 41.3, support 5.14, resistance 5.72. technical analysis of china unicom stock.
Why China Unicom is in focus today
- Volume at 1.9× the 20-day average
- Not covered by JournalArta in the last 14 days
Selected automatically from 72 HKEX (Hong Kong) stocks by a technical-signal score with daily weighted randomisation — not a recommendation.
Trend & Price Action
The shares sit in the lower part of their recent trading range: at 32% of the span between 20-day support at HK$5.14 and resistance at HK$5.72. The three-month range runs from HK$5.11 to HK$6.83, placing the latest price close to its period low. There was no new moving-average crossover in the latest session, so the technical structure offers no signal that a sustained trend reversal has begun. The Bollinger Bands—an indicator that tracks price relative to a moving average and its typical range—extend from HK$5.03 to HK$5.83, with the midpoint at HK$5.43. At 36% of the band’s width, the price is below the midpoint but not near the lower edge. The 14.7% band width is described as normal, not unusually compressed or wide. That suggests the latest jump has not yet produced an exceptional volatility signal. The key near-term test is whether the price can regain HK$5.43, the 20-day average. As shown in the chart, that level and resistance at HK$5.72 frame the hurdles above, while support at HK$5.14 marks the first important floor.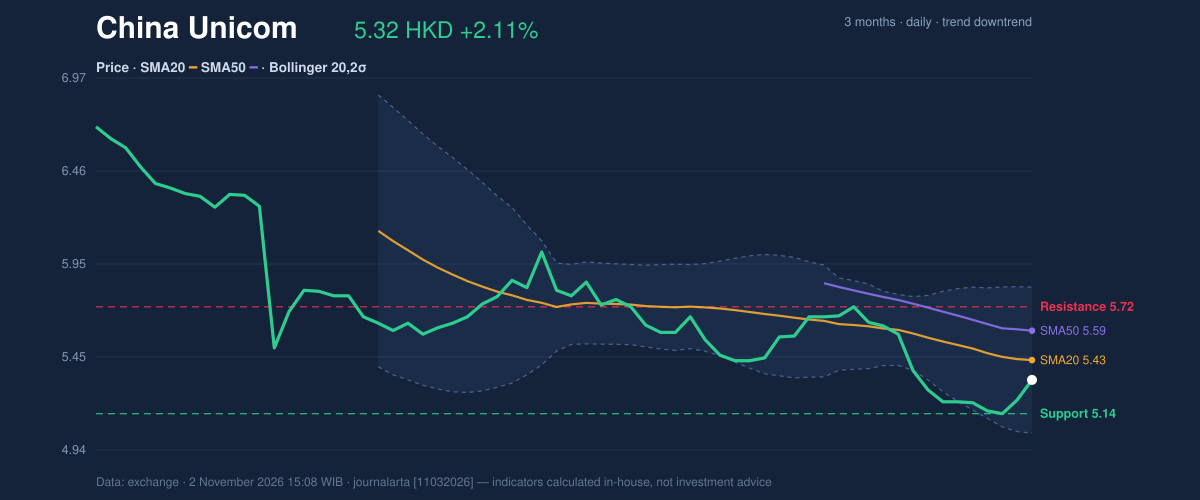
Oscillators & Momentum
Momentum indicators are mixed rather than firmly bullish. The RSI, which measures the pace of recent gains and losses, stands at 41.3, a neutral reading. It has rebounded from below 35, the dataset’s one bullish signal, but has not moved into territory that would establish strong upward momentum. The Stochastic reading is also neutral, with %K at 33.6 and %D at 17.9. RSI is recovering, but MACD still points to negative momentum. MACD is at -0.132, below its -0.120 signal line, while its histogram is -0.012. In plain terms, the indicator’s short-term momentum remains weaker than the trend line it is measured against. That divergence matters: a higher closing price alone does not confirm that buyers have taken control.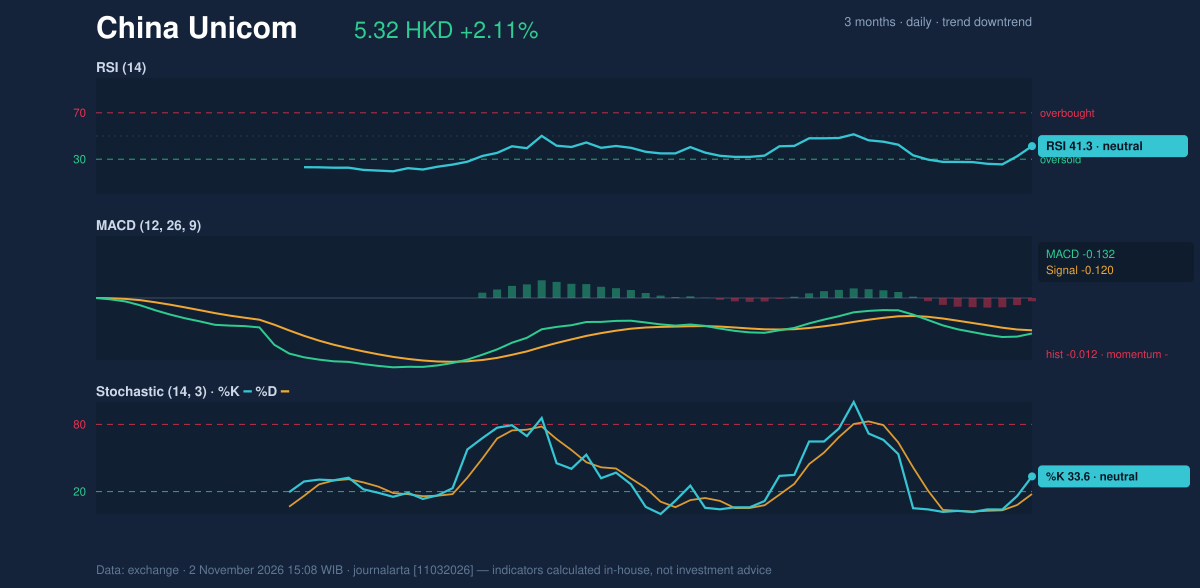
Volatility & Volume
Trading volume reached 61,031,846 shares, compared with a 20-day average of 32,268,015. Elevated participation can make a price move more meaningful, but volume alone does not reveal whether investors are accumulating or distributing shares. Here, on-balance volume (OBV), which tracks whether volume accompanies rising or falling prices, is declining. That weakens the case that the day’s jump reflects broad and sustained buying pressure. Average true range, a measure of typical daily price movement, is HK$0.13, or 2.4% of the share price. That indicates moderate volatility. The reference levels based on 1.5 times ATR are HK$5.13 below and HK$5.51 above the current price, giving traders a sense of how much room a routine move may involve—not a forecast. The volume spike is notable, but falling OBV makes its direction less convincing. The technical bias remains neutral: the rebound in RSI is countered by a confirmed downtrend and declining OBV.Key Levels & Scenarios
A sustained move above HK$5.43 would put the price back above its 20-day average; resistance at HK$5.72 is the next notable barrier. If the share price fails to hold HK$5.14, attention shifts to the three-month low of HK$5.11. Those levels are close, so a break in either direction could carry more information than another modest session gain. HK$5.14 is the near-term support to watch; HK$5.72 is the resistance that must give way for a stronger recovery case.Technical Verdict: HOLD (wait & see)
The neutral technical bias supports a wait-and-see reading rather than a directional call. First, the share price remains below both the 20-day and 50-day averages, while the 20-day average is falling. Second, MACD remains negative at -0.132 and below its signal line. Third, the RSI rebound from below 35 provides a counter-signal, but declining OBV limits its confirmation. This verdict is invalidated if the price falls below HK$5.14, the 20-day support.- Ideal Entry Range: HK$5.14–HK$5.43, bounded by 20-day support and the 20-day average.
- Exit Target: HK$5.72, the 20-day resistance.
- Stop Loss: HK$5.13, the price-minus-1.5×ATR reference level.
Summary Data China Unicom
| Last price | 5.32 HKD |
| Change 1 day / 5 days / 1 month | 2.11% / 2.31% / -1.94% |
| Trend / MA-cross | downtrend / none |
| SMA20 / SMA50 | 5.43 / 5.59 |
| RSI (14) / Stochastic %K | 41.3 / 33.6 |
| Bollinger %B / ATR | 36% / 0.13 |
| Support / Resistance 20 days | 5.14 / 5.72 |
| Data as of | 2 November 2026 15:08 WIB |
Disclaimer: This technical analysis is generated automatically from exchange data and indicators calculated by JournalArta, for information and education only. The verdict and the entry, target and stop-loss levels are not investment advice or a solicitation to buy or sell any security. Investment decisions and their risks rest solely with the reader.
Track China Unicom share price daily: live levels, support/resistance and our full China Unicom analysis history.