ST Engineering Stock Drops 2.27%, RSI Oversold In Focus
On November 2, 2026: price 9.92 SGD, trend downtrend, RSI 29.9, support 9.92, resistance 11.03. technical analysis of st engineering stock.
Why ST Engineering is in focus today
- Volume at 1.8× the 20-day average
- Closed at a 20-day low (9.92)
- Fresh death cross: SMA20 crossed below SMA50
- RSI(14) at 29.9 — oversold zone
- Downtrend extending (5-day change -2.55%)
Selected automatically from 32 SGX (Singapore) stocks by a technical-signal score with daily weighted randomisation — not a recommendation.
Trend & Price Action
ST Engineering closed below both its 20-day moving average of S$10.35 and its 50-day average of S$10.49. The 20-day average fell 2.09% over five days, while the death cross—when the shorter-term average moves below the longer-term one—formed four sessions before the latest session. Together, those measures point to weakening near- and medium-term price structure, rather than a cross that appeared only on Monday. The stock sits at the bottom of its 20-day range, with support at S$9.92 and resistance at S$11.03. Its three-month range runs from S$9.71 to S$11.29. The latest close is also near the three-month low, leaving little separation between current support and that broader-period floor. The price is testing support, not recovering above its trend averages.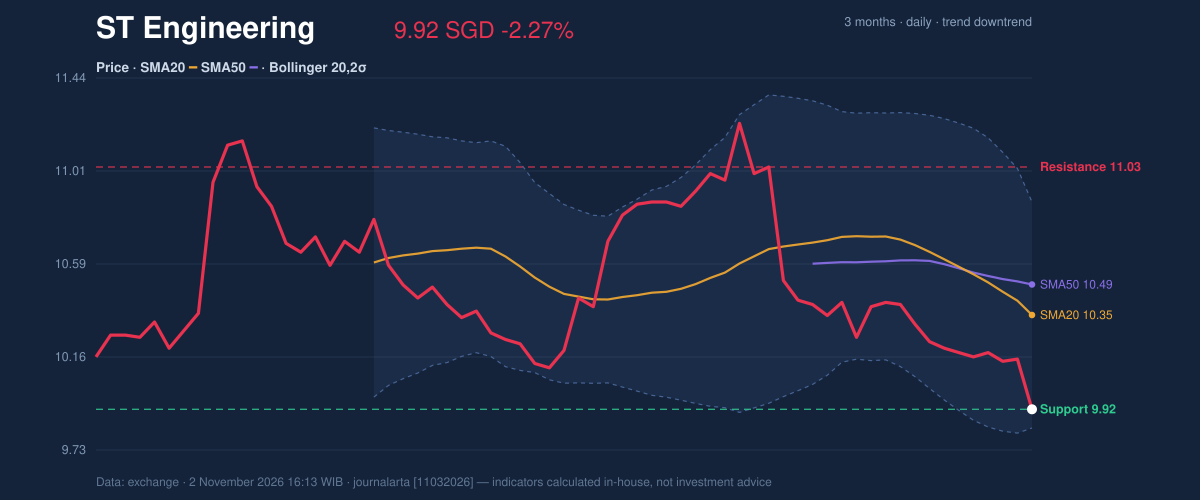
Oscillators & Momentum
The RSI is 29.9, in oversold territory. RSI measures the pace of recent gains and losses; a reading this low signals that selling has been intense, but it does not establish that a rebound has begun. The Stochastic is 26.6 against 24.3, a neutral reading, offering no strong reversal confirmation. The MACD is negative at -0.143, below its -0.105 signal line, with a histogram of -0.038. This means the momentum measure remains weaker than its signal baseline. In combination with falling OBV, the indicators show no clear bullish divergence—where momentum improves even as price falls—to counter the downtrend. Oversold conditions raise the possibility of a pause; negative MACD and falling OBV keep the pressure signal intact.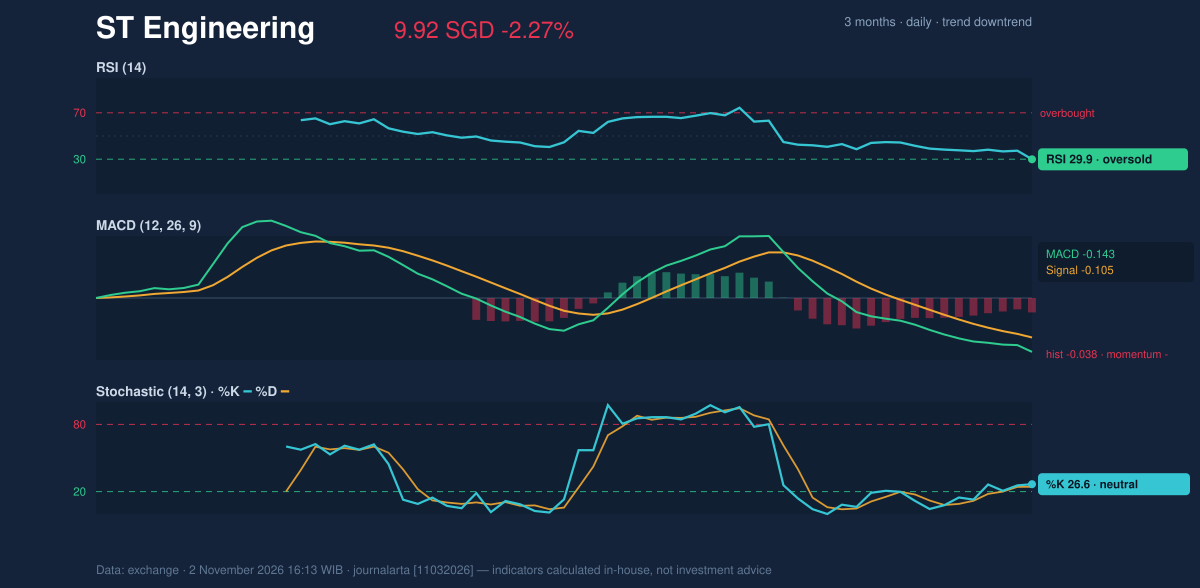
Volatility, Volume & Scenarios
The Bollinger Bands place the close near the lower boundary: the lower band is S$9.83, the middle band S$10.35 and the upper band S$10.87. At 8% of the way through the band, the price is pressed toward the downside, but the 10.0% band width is described as normal rather than unusually compressed. The bands therefore show weakness near the lower edge, not a volatility squeeze that would signal an imminent breakout. Average True Range is S$0.21, or 2.1% of the share price, indicating moderate daily volatility. If S$9.92 fails to hold, the three-month low at S$9.71 becomes the next reference level. A move back above S$10.23—the price-plus-1.5-ATR reference—would show some recovery from Monday’s close, but the moving averages and 20-day resistance would remain higher hurdles.Technical Verdict: SELL
The technical bias is bearish, supported by the death cross formed four sessions earlier, the close at the 20-day low on volume 1.8 times average, and falling OBV. The oversold RSI is a caution against treating the decline as a straight-line move, but it has not been accompanied by a positive MACD reading or a confirmed momentum reversal.- Entry range: S$9.92–S$10.23, using the latest close and the price-plus-1.5-ATR reference.
- Exit target: S$9.92, the 20-day support; if that level gives way, S$9.71, the three-month low, is the next reference.
- Stop-loss protection: Above S$11.03, the 20-day resistance; the nearer S$10.23 level is an ATR-based recovery checkpoint.
Summary Data ST Engineering
| Last price | 9.92 SGD |
| Change 1 day / 5 days / 1 month | -2.27% / -2.55% / -11.67% |
| Trend / MA-cross | downtrend / death |
| SMA20 / SMA50 | 10.35 / 10.49 |
| RSI (14) / Stochastic %K | 29.9 / 26.6 |
| Bollinger %B / ATR | 8% / 0.21 |
| Support / Resistance 20 days | 9.92 / 11.03 |
| Data as of | 2 November 2026 16:13 WIB |
Disclaimer: This technical analysis is generated automatically from exchange data and indicators calculated by JournalArta, for information and education only. The verdict and the entry, target and stop-loss levels are not investment advice or a solicitation to buy or sell any security. Investment decisions and their risks rest solely with the reader.
Track ST Engineering share price daily: live levels, support/resistance and our full ST Engineering analysis history.