UOB Stock Technicals: Drops 1.72% on Monday, Death Cross Pressure
On November 2, 2026: price 40.66 SGD, trend downtrend, RSI 39.3, support 39.96, resistance 43.72. technical analysis of uob stock. UOB Stock Technicals — full…

Trend & Price Action
UOB’s close was below its 20-day simple moving average (SMA) of S$41.42 and its 50-day average of S$41.75. The SMA20 is falling 1.10% over five days, a sign that the shorter-term trend is not merely below the longer-term measure but still weakening. A death cross—the SMA20 crossing below the SMA50—formed two sessions before the latest session, reinforcing that bearish structure rather than marking a signal formed on Monday. The shares are near the lower end of their recent trading range: the price sits 19% of the way between the 20-day support at S$39.96 and resistance at S$43.72. The three-month range runs from S$39.40 to S$43.75. As shown in the chart, the price is approaching support while remaining below both averages; a move back above the SMA20 would be an early sign of improvement, but would not by itself erase the broader weakness.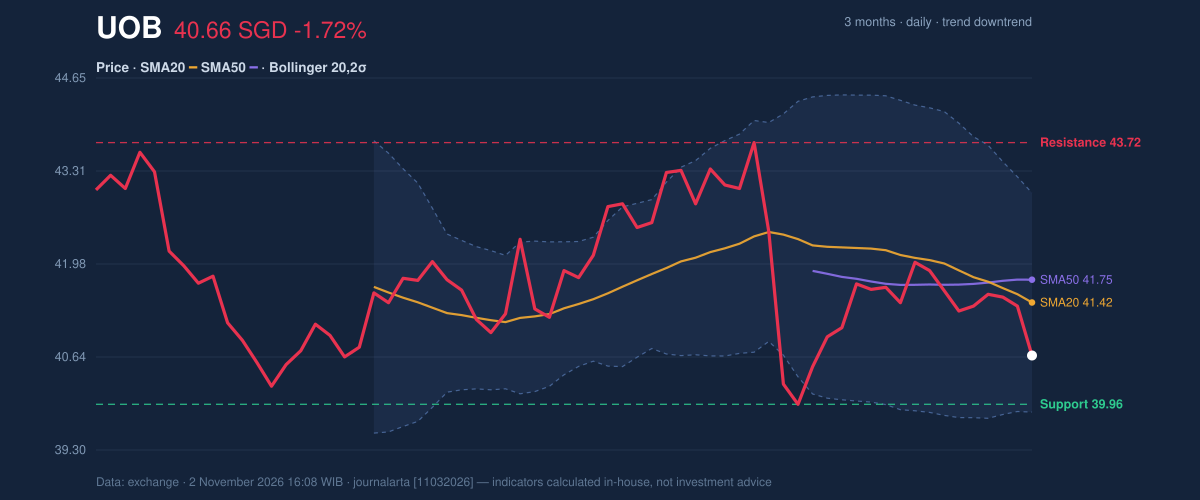
Oscillators & Momentum
Momentum indicators are mixed in a way that argues against treating the decline as either exhausted or decisively accelerating. The RSI is 39.3, a neutral reading that is below the midpoint but not at an extreme. The Stochastic %K is 16.6 against %D at 46.0, placing the faster measure in oversold territory. That can reflect selling pressure, though oversold conditions alone do not confirm a reversal. The MACD is -0.206, below its -0.157 signal line, with a histogram of -0.049. The negative histogram indicates that downside momentum has taken hold; it has just turned negative, making that change a fresh point of confirmation for the bearish setup. The combination of a weak MACD and oversold Stochastic captures the tension in the chart: selling has been persistent, but a short-lived rebound remains possible.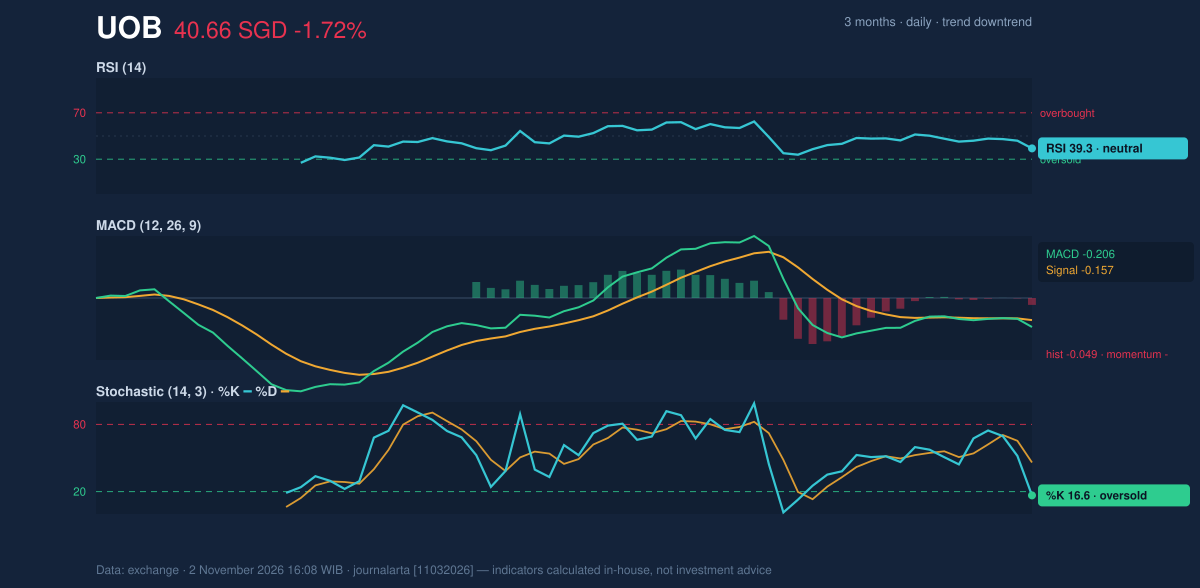
Volatility & Volume
The Bollinger Band %B reading of 26% places the price in the lower portion of the band, whose boundaries are S$39.85 and S$43.00. Its 7.6% width is narrowing, or “squeezing”: volatility has contracted, which can precede a more pronounced move, but does not determine its direction. With the price already under the moving averages and MACD negative, the prevailing trend gives a downside break more confirmation than an upside one would have. The 14-day average true range is S$0.64, equivalent to 1.6% of the share price, indicating moderate volatility. Monday’s volume was 2,784,740 shares, or 0.8 times the 20-day average of 3,529,787. Lower-than-normal activity means the decline did not come with unusually heavy turnover, but falling OBV—the running measure of volume flow—suggests participation has been weakening rather than accumulating behind a recovery.Key Levels & Scenarios
The first level to watch below is S$39.96, the 20-day support; the three-month low is S$39.40. A sustained break below support would expose that lower range floor. On the upside, S$41.42 is the SMA20, followed by S$43.72 resistance, close to the three-month high of S$43.75. A move above the short average could ease immediate pressure, while reclaiming the resistance area would provide stronger evidence that the downtrend is changing. The technical signals are bearish, with four of seven signals pointing lower and none bullish. The core signal is a falling trend reinforced by the death cross, negative MACD and declining OBV, although oversold Stochastic leaves room for a countertrend bounce.Technical Verdict: SELL
This verdict follows the bearish technical bias, not a forecast of UOB’s fundamental value. The strongest supporting signals are the death cross formed two sessions before Monday, MACD momentum below its signal line, and falling OBV. The oversold Stochastic reading is a caution that a rebound may interrupt the decline, not a confirmed reversal. - Indicative entry range: S$40.66–S$41.42, spanning the latest close to the SMA20. - Exit target: S$39.96, the 20-day support; the three-month low at S$39.40 is the next reference if support gives way. - Stop-loss protection: S$43.72, above the 20-day resistance. - Invalidation: The bearish verdict is invalidated if price breaks above S$43.72. For non-traders, the indicators currently show more evidence of continued weakness than a durable recovery, while the support zone is the nearest test of that view.Technical analysis is not an investment recommendation.
Why UOB is in focus today
- Fresh death cross: SMA20 crossed below SMA50
- Downtrend extending (5-day change -1.55%)
Selected automatically from 32 SGX (Singapore) stocks by a technical-signal score with daily weighted randomisation — not a recommendation.
Summary Data UOB
| Last price | 40.66 SGD |
| Change 1 day / 5 days / 1 month | -1.72% / -1.55% / -5.57% |
| Trend / MA-cross | downtrend / death |
| SMA20 / SMA50 | 41.42 / 41.75 |
| RSI (14) / Stochastic %K | 39.3 / 16.6 |
| Bollinger %B / ATR | 26% / 0.64 |
| Support / Resistance 20 days | 39.96 / 43.72 |
| Data as of | 2 November 2026 16:08 WIB |
Disclaimer: This technical analysis is generated automatically from exchange data and indicators calculated by JournalArta, for information and education only. The verdict and the entry, target and stop-loss levels are not investment advice or a solicitation to buy or sell any security. Investment decisions and their risks rest solely with the reader.
Track UOB share price daily: live levels, support/resistance and our full UOB analysis history.