RSI Oversold, Wilmar Stock Drops 1.99% on Monday
On November 2, 2026: price 2.95 SGD, trend downtrend, RSI 17.6, support 2.95, resistance 3.60. technical analysis of wilmar stock. RSI Oversold — full details…

Why Wilmar is in focus today
- Volume at 2.0× the 20-day average
- Closed at a 20-day low (2.95)
- Trading near its 3-month low (2.93)
- RSI(14) at 17.6 — oversold zone
- Downtrend extending (5-day change -10.88%)
Selected automatically from 32 SGX (Singapore) stocks by a technical-signal score with daily weighted randomisation — not a recommendation.
Trend & Price Action
The decline extends beyond the latest session: Wilmar lost 10.88% over five days and 15.23% over one month. At S$2.95, the stock is below its 20-day simple moving average, or SMA20, at S$3.37 and its 50-day average at S$3.57. These averages track recent prices; trading beneath both indicates that weakness is not confined to a short-lived pullback. The 20-day average itself fell 2.97% over five days, reinforcing the downtrend rather than suggesting a flattening base. There was no new moving-average crossover in the latest data. Wilmar ended at the bottom of its 20-day range, with support at S$2.95 and resistance at S$3.60; its three-month range runs from S$2.93 to S$4.00. The price is pressing a key floor, but has not yet shown evidence of a reversal. A sustained move back above the lower Bollinger band at S$3.01 would be an early sign of recovery from the latest extreme; the SMA20 at S$3.37 is a more substantial hurdle.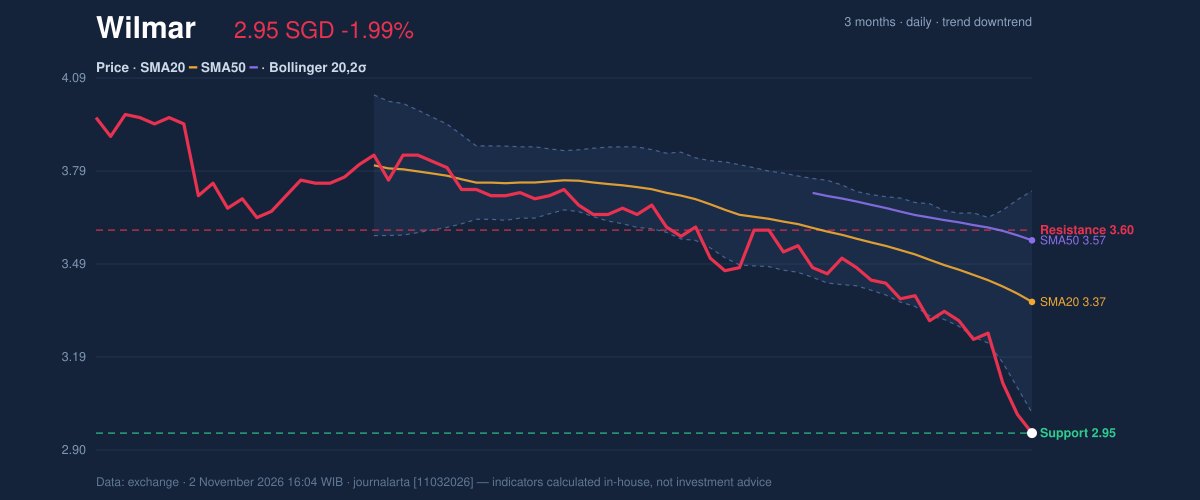
Oscillators & Momentum
The indicators show how stretched the sell-off has become, not that it has necessarily ended. The RSI, a measure of the pace of recent gains and losses, is 17.6, in oversold territory. The Stochastic oscillator, which compares the latest price with its recent trading range, is also oversold: %K is 3.4 and %D is 1.8. Such readings can accompany a short-term rebound, but in a persistent downtrend they may remain depressed. The MACD, a trend-and-momentum indicator, remains negative at -0.144, below its -0.106 signal line, with a -0.038 histogram. That alignment says downward momentum is still in control, despite the oversold readings. It therefore argues against treating those readings as confirmation of a bottom.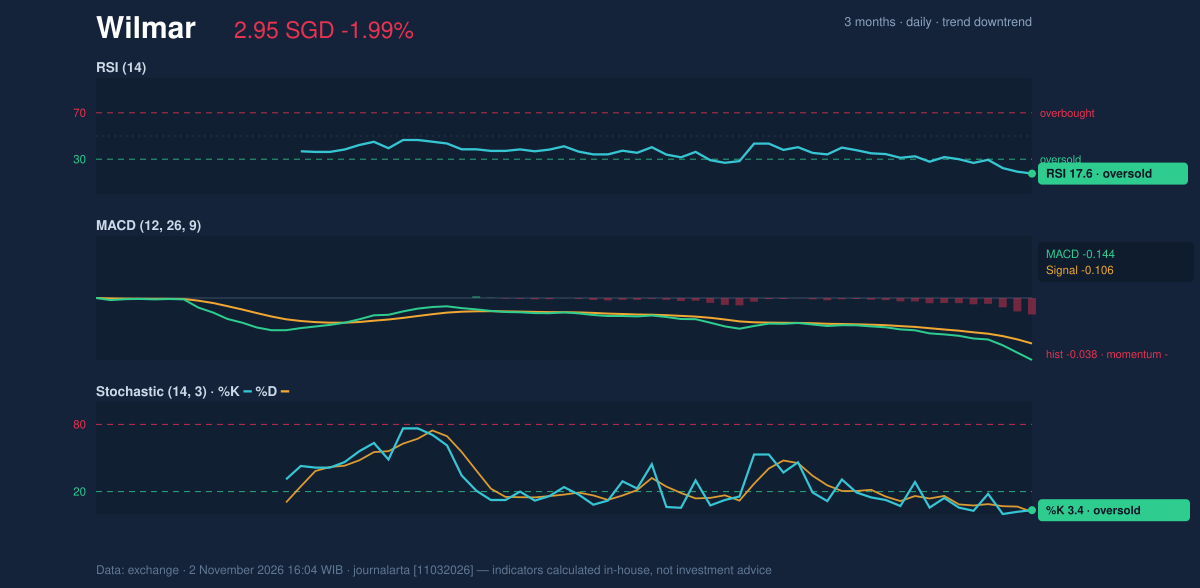
Volatility & Volume
Wilmar’s Bollinger bands are widening, a sign that recent price swings have increased. The lower band is S$3.01 and the %B reading is -9%, placing the price below that band. This marks an unusually weak position relative to recent volatility; it does not, by itself, establish that the stock must rebound. The average true range, which measures typical daily movement, is S$0.09, or 2.9% of the share price, indicating moderate volatility by that measure. Volume adds a cautionary signal. The latest 12,053,200 shares traded were 2.0 times the 20-day average of 5,945,035, while on-balance volume (OBV), a cumulative measure of buying and selling pressure, was falling. A high-volume close at the range floor can indicate forceful selling, and declining OBV suggests that participation has not yet turned decisively in buyers’ favour.Key Levels & Scenarios
S$2.95 is the immediate 20-day support, with the three-month low at S$2.93. Holding that area would keep the price near its established floor, though the momentum and volume readings leave the risk of another test open. A break below S$2.93 would put the reference level at S$2.82—price minus 1.5 times ATR—in focus. On the upside, S$3.01 is the lower Bollinger band, followed by S$3.08, the price-plus-1.5-ATR reference level. The more important 20-day resistance is S$3.60. A move through nearby levels would be more persuasive if accompanied by improving OBV and a less negative MACD; without those changes, a bounce could remain a countertrend move.Technical Verdict: HOLD
The neutral technical bias calls for a wait-and-see reading, rather than a directional signal. The strongest reasons are the oversold RSI at 17.6 and Stochastic readings, which flag stretched selling; the negative MACD and falling OBV, which show that momentum and volume have not confirmed a turn; and the high-volume close at the 20-day low, which keeps downside pressure relevant. The verdict is invalidated if price breaks below the S$2.93 three-month low. - Ideal entry range: S$2.93–S$3.01, around the three-month low and lower Bollinger band. - Exit target: S$3.60, the 20-day resistance. - Stop-loss protection: S$2.82, the price-minus-1.5-ATR reference level. For non-traders, the indicators show a share price that is unusually weak but has not yet produced convincing evidence that the decline has turned. Data: Singapore Exchange price and trading information; technical indicators calculated from the supplied market data for Monday, November 2, 2026.Summary Data Wilmar
| Last price | 2.95 SGD |
| Change 1 day / 5 days / 1 month | -1.99% / -10.88% / -15.23% |
| Trend / MA-cross | downtrend / none |
| SMA20 / SMA50 | 3.37 / 3.57 |
| RSI (14) / Stochastic %K | 17.6 / 3.4 |
| Bollinger %B / ATR | -9% / 0.09 |
| Support / Resistance 20 days | 2.95 / 3.60 |
| Data as of | 2 November 2026 16:04 WIB |
Disclaimer: This technical analysis is generated automatically from exchange data and indicators calculated by JournalArta, for information and education only. The verdict and the entry, target and stop-loss levels are not investment advice or a solicitation to buy or sell any security. Investment decisions and their risks rest solely with the reader.
Track Wilmar share price daily: live levels, support/resistance and our full Wilmar analysis history.