Nongfu Spring Golden Cross Formed: Stock Gains 2.65% (November 2, 2026)
On November 2, 2026: price 43.46 HKD, trend uptrend, RSI 63.7, support 39.36, resistance 43.46. technical analysis of nongfu spring stock.
Why Nongfu Spring is in focus today
- Volume at 2.3× the 20-day average
- Closed at a 20-day high (43.46)
- Fresh golden cross: SMA20 crossed above SMA50
- Uptrend confirmed (5-day change 4.98%)
- Not covered by JournalArta in the last 14 days
Selected automatically from 72 HKEX (Hong Kong) stocks by a technical-signal score with daily weighted randomisation — not a recommendation.
Trend & Price Action
The close at HK$43.46 also matches the stated 20-day resistance, placing the share at the top of its recent trading range. The breakout came with volume of 12,829,089 shares, against a 20-day average of 5,686,382, while on-balance volume (OBV)—a measure that tracks buying and selling pressure through volume—was rising. That combination supports the move: more shares changed hands as the price advanced. There is a distinction between clearing a range and having room to run. At HK$43.46, Nongfu Spring is above the upper Bollinger Band at HK$42.96; the band’s %B reading is 113%, indicating the price has moved beyond the band’s upper boundary. That can accompany strong momentum, but it also means the share is stretched relative to its recent average. The three-month high, HK$45.18, is the next significant reference level.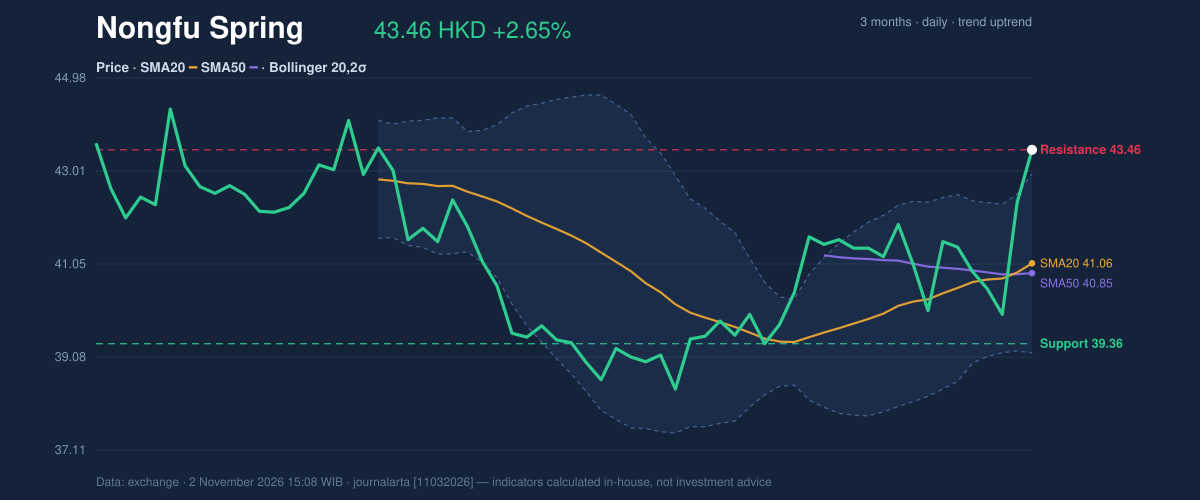
Oscillators & Momentum
Momentum indicators are positive, though not uniformly comfortable. The RSI is 63.7, in neutral territory, suggesting strength without a reading that the data classifies as overbought. By contrast, the Stochastic is overbought, with %K at 92.2 and %D at 62.3. This oscillator compares a closing price with its recent range; a high reading can mean the rally is running hot, even if it does not by itself establish a reversal. MACD adds confirmation: its histogram is positive at 0.189, with MACD at 0.362 above its signal line at 0.173. A positive histogram means the faster momentum measure is ahead of its signal measure. The contrast matters: MACD and RSI support the upward trend, while Stochastic warns that near-term pullbacks are possible after the sharp advance.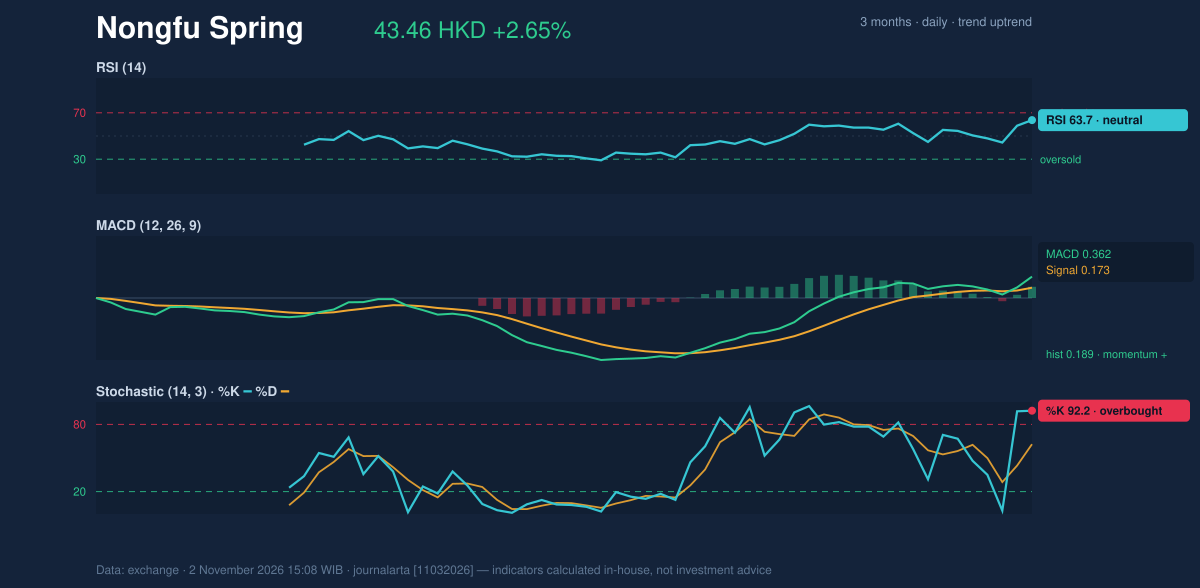
Volatility & Key Levels
The Bollinger reading reinforces the breakout but raises the risk of a pause. The price is above the upper band, while band width is 9.2% and classified as normal—not an indication, on these figures, of an extreme volatility expansion. Average true range (ATR), which measures typical price movement, is HK$1.28, or 2.9% of the share price: moderate volatility. The key test is whether the former ceiling at HK$43.46 can hold as a reference point after the breakout. Below that, the 20-day support is HK$39.36; the 20-day average at HK$41.06 is another trend marker. A retreat toward these levels would test whether recent buyers remain engaged. Above HK$43.46, the three-month high at HK$45.18 is the next resistance; the ATR-based level of HK$45.38 provides a separate volatility reference, not a guaranteed destination.Technical Verdict: BUY
The technical bias is bullish, with five of seven signals positive and none bearish. The strongest evidence is the recent golden cross, the volume-backed close at a 20-day high, and the positive MACD histogram alongside rising OBV. The main caution is the overbought Stochastic reading, which increases the chance of a near-term pause. The bullish verdict is invalidated if the price falls below HK$39.36, the 20-day support.- Ideal Entry Range: HK$41.06–HK$43.46, bounded by the 20-day average and 20-day resistance.
- Exit Target: HK$45.18, the three-month high and next resistance reference above the breakout.
- Stop Loss: HK$39.36, below the 20-day support.
| Metric | Reading |
|---|---|
| Latest price | HK$43.46 |
| Session change | +2.65% |
| Volume vs. 20-day average | 2.3× |
| RSI (14) | 63.7, neutral |
| Stochastic | %K 92.2 / %D 62.3, overbought |
| MACD histogram | 0.189, positive |
| 20-day support / resistance | HK$39.36 / HK$43.46 |
| Three-month low / high | HK$37.90 / HK$45.18 |
Summary Data Nongfu Spring
| Last price | 43.46 HKD |
| Change 1 day / 5 days / 1 month | 2.65% / 4.98% / 9.91% |
| Trend / MA-cross | uptrend / golden |
| SMA20 / SMA50 | 41.06 / 40.85 |
| RSI (14) / Stochastic %K | 63.7 / 92.2 |
| Bollinger %B / ATR | 113% / 1.28 |
| Support / Resistance 20 days | 39.36 / 43.46 |
| Data as of | 2 November 2026 15:08 WIB |
Disclaimer: This technical analysis is generated automatically from exchange data and indicators calculated by JournalArta, for information and education only. The verdict and the entry, target and stop-loss levels are not investment advice or a solicitation to buy or sell any security. Investment decisions and their risks rest solely with the reader.
Track Nongfu Spring share price daily: live levels, support/resistance and our full Nongfu Spring analysis history.