Testing Support Level, ADBE Stock Gains 1.02% Today
On September 24, 2026: price 240.69 USD, trend sideways, RSI 39.5, support 238.25, resistance 292.79. technical analysis of adbe stock.

Adobe Inc. fell to 240.69 USD on Nasdaq, up 1.02% from the previous close but still under pressure after a 12.13% drop over the past month, according to Yahoo Finance data for 23 September 2026 20:30 WIB. The move matters less as a one-day bounce than as a test of whether a stock that has been sliding can stabilize while sitting just above nearby support and well below its short-term averages.
The chart shows a name that is still trading in a corrective posture. Price remains below the SMA20 at 264.11 and below the SMA50 at 257.13, which tells investors the recent trend is still weaker than the medium-term trend. With no fresh MA cross, there is no new technical confirmation that the downtrend has reversed. The broader pattern is described as sideways, but the slope of the SMA20 at -2.58% over 5 days suggests the “sideways” label is really masking a mild downward drift. In plain terms: the stock is not collapsing, but it has not yet proved it can reclaim control.
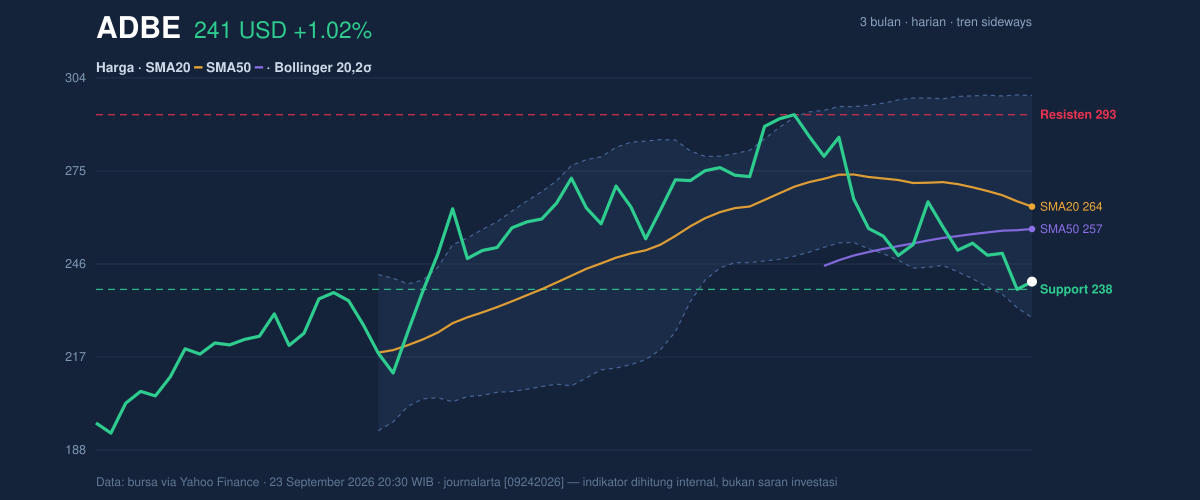
The price is also sitting near the lower edge of its recent trading band. The 20-day support at 238.25 USD is close, while the 20-day resistance at 292.79 USD is far overhead, leaving the share price in the lower part of that range and only 4% from the bottom of it, as shown in the chart. That positioning usually signals fragility: buyers have not been strong enough to push the stock back toward the middle of the band, but sellers also have not forced a breakdown through support. The Bollinger lower band at 229.42 is the next technical cushion below current levels, and the %B at 16% means the stock is trading near the lower end of its Bollinger envelope. When a stock sits that close to the bottom of the band, it often reflects depressed sentiment rather than outright panic.
The band structure is important because the Bollinger width of 26.3% is widening, which points to higher volatility. A widening band often means the market is preparing for a larger move, but it does not say direction by itself. Here, the direction clues lean cautious: the price is still below both moving averages, and the band is expanding while the stock trades near the lower boundary. That combination usually means any rebound attempt may face skepticism unless it can reclaim the middle band at 264.11 USD.
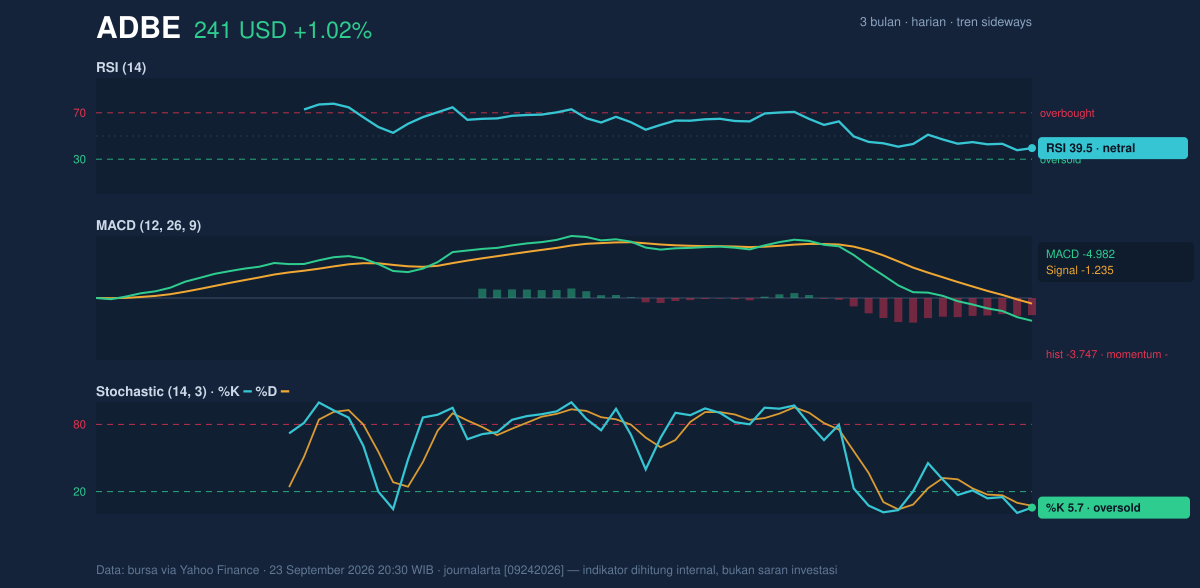
Momentum signals are mixed, but not encouraging enough to call the weakness fully washed out. RSI at 39.5 is technically neutral, which means the stock is not deeply oversold on that measure even after the recent decline. Yet the Stochastic %K at 5.7 and %D at 7.3 are both in oversold territory, showing the stock has been pushed to a short-term extreme. That often hints at a bounce, but not necessarily a durable one. The key distinction is that oversold does not mean strength; it means the market may be stretched. Meanwhile, the MACD at -4.982 with a signal line at -1.235 and a histogram of -3.747 shows downside momentum remains in place. In chart terms, the trend engine is still running negative even if the oscillator is tired.
Volume does not yet confirm a meaningful recovery. Last volume was 3,855,100, below the 20-day average of 5,755,130, or about 0.7x normal. That matters because rebounds are more credible when they arrive with stronger participation; lighter turnover can mean the move is more about short covering or a pause in selling than a broad change in conviction. The OBV is falling, which reinforces that message: the balance of volume has been favoring distribution rather than accumulation. If buyers were truly taking control, the on-balance volume line would usually start to improve before the price does.
The stock’s ATR(14) of 10.42, equal to 4.3% of price, says the name can move sharply even without a major headline. That keeps both the upside and downside open in the near term. On the downside, a clean break below 238.25 USD would expose the 229.42 USD lower Bollinger band and signal that the recent support has failed. On the upside, the first real sign of repair would be a move back above 257.13 USD and then 264.11 USD, because those levels would put the stock back above its short- and medium-term moving averages and closer to the center of the trend structure. The 3-month high at 294.53 USD and 3-month low at 191.80 USD frame the larger range: Adobe is not near panic lows, but it is far from the upper end of its recent trading history.
Technical Verdict: HOLD (wait & see)
HOLD (wait & see) because the chart is still below the SMA20 and SMA50, MACD remains negative, and OBV is falling, even though the Stochastic is oversold and price is near support.
- Ideal Entry Range: 238.25 to 229.42 USD, where support and the lower Bollinger band sit.
- Exit Target: 257.13 to 264.11 USD, the moving-average zone that would show the stock is reclaiming short-term control.
- Stop Loss protection: below 229.42 USD, since a break there would weaken the current support structure.
- Verdict invalidated if price falls below 229.42 USD and fails to recover quickly.
For non-traders: Adobe is sitting at a technical crossroads, where the chart is weak but stretched enough to leave room for a bounce if support holds.
Summary Data ADBE
| Last price | 240.69 USD |
| Change 1 day / 5 days / 1 month | 1.02% / -3.92% / -12.13% |
| Trend / MA-cross | sideways / none |
| SMA20 / SMA50 | 264.11 / 257.13 |
| RSI (14) / Stochastic %K | 39.5 / 5.7 |
| Bollinger %B / ATR | 16% / 10.42 |
| Support / Resistance 20 days | 238.25 / 292.79 |
| Data as of | 23 September 2026 20:30 WIB |

