AstraZeneca Stock Technicals Today: Drops 2.15%, Momentum Gains
On September 25, 2026: price 12,400.00 GBp, trend sideways, RSI 55.3, support 11,650.00, resistance 12,672.00. technical analysis of astrazeneca stock.

Shares in AstraZeneca on the London Stock Exchange were 12,400.00 GBp at 14:00 WIB on 23 September 2026, down 2.15% from the previous close, even though the stock still trades above SMA20 at 12,121.90 and above SMA50 at 12,190.56. That combination matters: the price is slipping on the day, but the broader chart has not broken its short-term trend structure. As shown in the chart, AstraZeneca remains in a sideways trend, with the moving averages still acting as a soft floor rather than a clear bear signal.
Trend & Price Action
The latest move leaves the stock in the upper half of its recent range, at 73% of the 20-hour range, which tells us the market is still closer to resistance than to support. That positioning is important because it shows the share price has not lost its recent gains completely, but it is also not building fresh upside momentum from a low base. The SMA20 slope of 0.68% over 5 days points to a modest upward tilt, but the lack of a new MA-cross suggests the chart is still waiting for a cleaner directional signal.
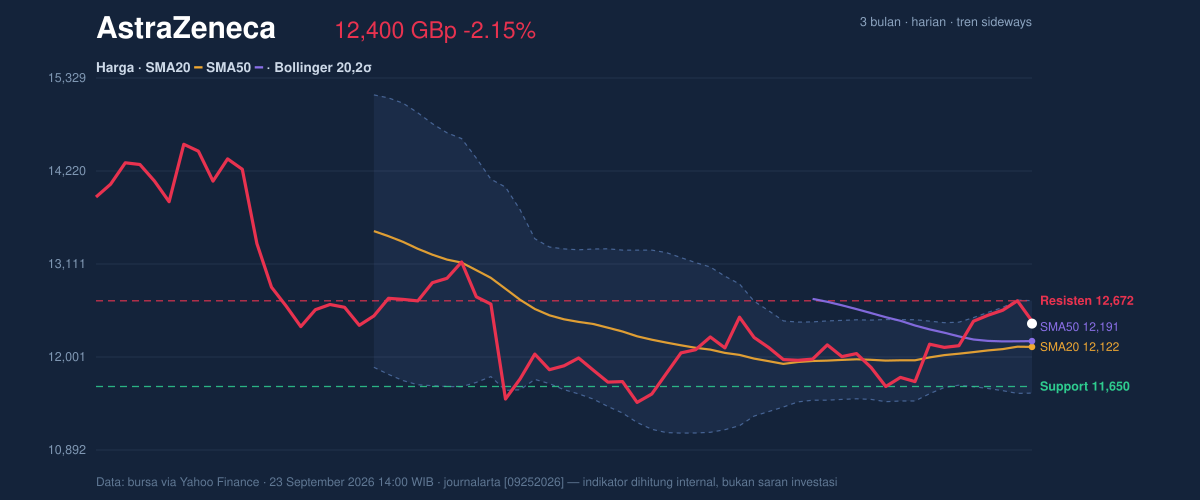
The most immediate ceiling sits at 12,672.00, with the Bollinger upper band almost identical at 12,672.76. When price sits just beneath both, it usually means the market has already tested the upper edge of its recent trading envelope and is pausing rather than breaking decisively higher. The broader range also matters: AstraZeneca is still well below the 3-month high of 14,686.00, but comfortably above the 3-month low of 9,892.00, which reinforces the “range-bound, not broken” reading.
Oscillators & Momentum
The momentum picture is mixed but not damaged. RSI at 55.3 is neutral, which means the stock is neither stretched on the upside nor washed out on the downside. In plain language, that leaves room for either direction, but it does not yet justify a strong trend call. The Stochastic reading of 77.2 / 89.7 sits near the upper end of its scale, which suggests the recent bounce has progressed far enough that short-term upside may be tiring, even if the broader trend has not rolled over.
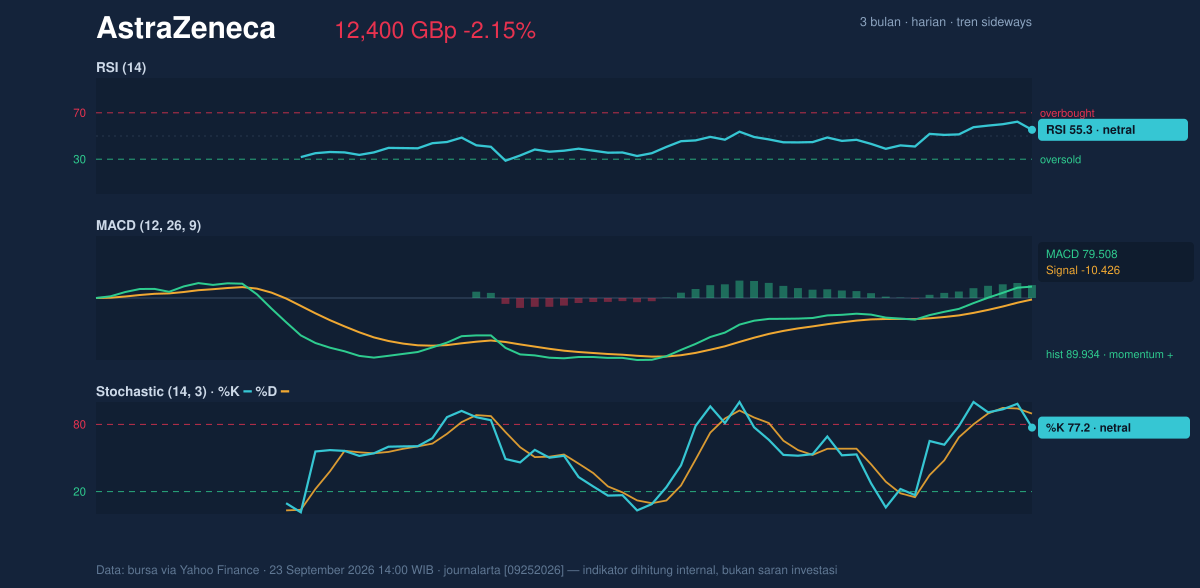
The more telling signal is MACD. MACD at 79.508 versus a signal line at -10.426, with a histogram of 89.934, indicates positive momentum remains in place. For readers less familiar with the term, MACD compares faster and slower price trends; when it stays above the signal line and the histogram is positive, it usually means buyers still have the stronger hand, even if the stock is pausing. That said, the neutral RSI and stretched Stochastic mean the momentum is positive, but not unchallenged.
Volatility & Volume
Volatility is moderate, not explosive. ATR at 280.76, or 2.3% of price, suggests the stock can move, but not in a disorderly fashion. The Bollinger band width of 9.1% is described as normal, which means there is no squeeze building up pressure for a sudden breakout, nor is there an expansion warning of a panic move. The price sitting at %B 75% shows it is in the upper part of the band structure, but not yet pressing against the top in a way that usually signals overheating.
Volume is the one area that tempers the bullish tone. The latest trade volume of 1,690,605 is only 0.5× the 20-hour average of 3,317,493, which means the day’s move has occurred on relatively quiet participation. That matters because breakouts built on thin turnover are easier to fade. Still, OBV is rising, and that is a constructive sign: on-balance volume tracks whether money flow is generally accumulating or distributing, so a rising line suggests buyers have been more persistent than the day’s headline volume alone implies.
Key Levels & Scenarios
The chart’s main pivot is the 12,672.00 resistance, which aligns closely with the Bollinger upper band at 12,672.76. A clear move through that area would tell the market that AstraZeneca is no longer merely ranging near the top of its band; it would imply the stock is trying to convert resistance into support. On the downside, 12,121.90 is the first technical cushion, because it is both the Bollinger middle band and the SMA20. Below that, 11,650.00 support becomes the key line to watch, since a loss of that zone would suggest the recent recovery has failed to hold.
The current setup is therefore one of controlled tension. Price is above both short-term averages, momentum is still positive, and OBV is improving, but the stock is also sitting close to resistance with volume running below average. That combination usually signals a market that is constructive, yet not fully convinced. The chart supports a cautiously positive bias, but only while the price holds above the moving-average band and can reclaim the resistance zone with better participation.
Technical Verdict: HOLD (wait & see)
HOLD (wait & see)
- RSI at 55.3 is neutral, so there is no strong overbought or oversold signal.
- MACD remains positive, but Stochastic at 77.2 / 89.7 shows the short-term move is getting extended.
- Price is above SMA20 and SMA50, yet still capped just under 12,672.00 resistance and the upper Bollinger band.
Verdict invalidated if price falls below 11,650.00, because that would break the nearest support and weaken the current range structure.
- Ideal Entry Range: 12,121.90 to 12,190.56
- Exit Target (Target Price): 12,672.00 to 12,672.76
- Stop Loss protection: 11,650.00
For non-traders, this means the shares still look technically steady, but the chart is asking for confirmation before the next move.
Volume last traded: 1,690,605.
Summary Data AstraZeneca
| Last price | 12,400.00 GBp |
| Change 1 day / 5 days / 1 month | -2.15% / 2.18% / -0.61% |
| Trend / MA-cross | sideways / none |
| SMA20 / SMA50 | 12,121.90 / 12,190.56 |
| RSI (14) / Stochastic %K | 55.3 / 77.2 |
| Bollinger %B / ATR | 75% / 280.76 |
| Support / Resistance 20 days | 11,650.00 / 12,672.00 |
| Data as of | 23 September 2026 14:00 WIB |



