MA Stock Gains 1.10% Today, Testing Support Level
On September 25, 2026: price 566.08 USD, trend sideways, RSI 47.0, support 559.92, resistance 598.47. technical analysis of ma stock. MA Stock Gains — full…

Mastercard’s shares rose to 566.08 USD on the NYSE, up 1.10% from the previous close of 559.92, but the move still leaves the stock below its short-term trend markers and inside a narrow trading band that has not yet resolved. The message from the tape is not that momentum has turned strongly bullish; it is that the stock is trying to stabilize after a month-long slide, with the market waiting for a cleaner signal from price, volume, and momentum before committing to a direction.
Trend & Price Action
As shown in the chart, Mastercard is trading below its SMA20 at 576.10 and only slightly under the SMA50 at 568.09, which matters because these moving averages act like reference lines for short- and medium-term trend direction. When price sits below the faster average and the faster average is also easing lower, it usually signals that buyers have not yet regained control. The stock is still described as sideways, but the slope of the SMA20 at -0.88% over 5 days shows that the sideways pattern is leaning downward rather than flat. In plain terms: this is a market that is pausing, but not yet repairing.
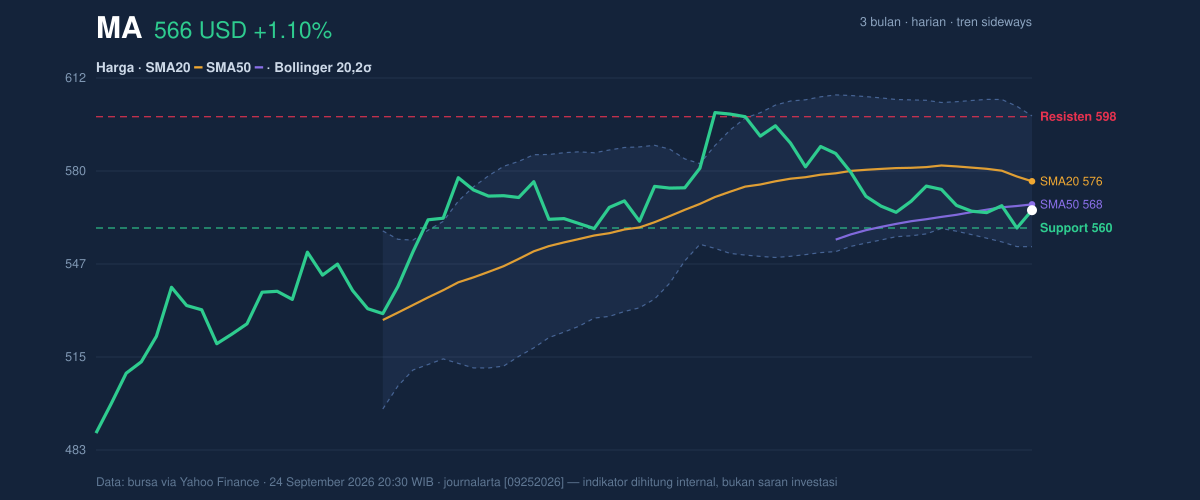
The position within the recent range also matters. With the stock at 16% of the 20-hour range, Mastercard is sitting closer to support than resistance, which can be constructive if buyers defend the floor. But it can also be a warning that the market is still near the lower part of its operating band after a weak month, with the 1-month change at -5.55%. The 3-month high of 601.23 and 3-month low of 488.58 frame the larger battle: the stock is far from panic territory, but it is also not close enough to the highs to suggest a strong trend recovery.
One line stands out.
The price is holding, but it is not yet leading.
Oscillators & Momentum
Momentum indicators are mixed, and that mix is important because it shows why the price has not broken decisively in either direction. The RSI at 47.0 is neutral, which means the stock is neither overbought nor oversold. That usually points to indecision rather than conviction. The Stochastic %K at 31.0 and %D at 21.6 also sits in neutral territory, but it is closer to the lower end of the scale, suggesting the stock has been weak enough to attract some bargain interest without yet generating a strong reversal signal.
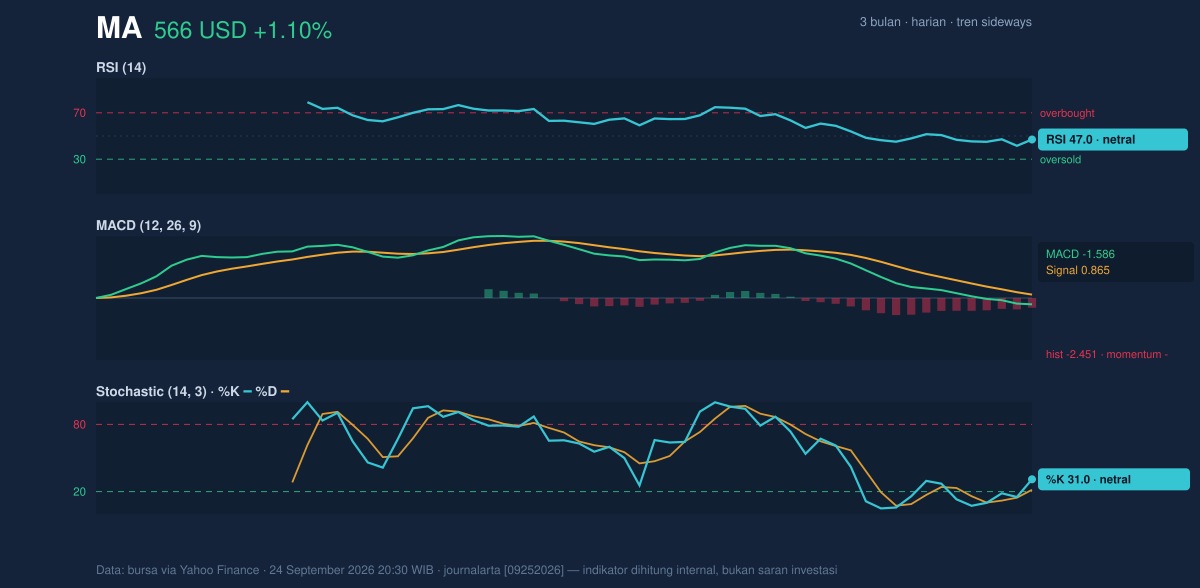
The more telling indicator is the MACD at -1.586, with the signal line at 0.865 and the histogram at -2.451. MACD measures trend momentum; when it is below the signal line and the histogram is negative, it means downside pressure still outweighs upside traction. This is the clearest technical warning in the set. Even with a small daily gain, the underlying momentum has not flipped. So while the stock is not oversold, it is also not showing the kind of force that typically accompanies a durable rebound.
Volatility & Volume
Volatility is subdued. The ATR(14) at 8.36, equal to 1.5% of price, implies relatively low daily movement. That can be a precursor to expansion, especially when paired with the Bollinger Band width of 7.9%, which is described as squeezing. A squeeze means the trading range has tightened; in technical terms, compressed volatility often precedes a larger move. The direction of that move is not guaranteed, but the setup tells traders that the current calm may not last.
The price is also sitting at %B 28%, which places it in the lower portion of the Bollinger structure and closer to the lower band at 553.46 than the upper band at 598.74. That positioning reinforces the idea that the stock is still recovering from weakness rather than climbing inside a confirmed upswing.
Volume is not confirming a strong turn. Last volume was 2,165,400, below the 20-day average of 2,578,070, or about 0.8x normal. Lower-than-average volume on an uptick often means the move lacks broad participation. The OBV is falling, which is especially important: on-balance volume tracks whether money flow is accumulating or leaving the stock. A declining OBV alongside a weak momentum profile suggests that the recent price action has not yet attracted sustained demand.
Key Levels & Scenarios
The nearest line in the sand is the 20-hour support at 559.92, which is effectively the market’s immediate floor. The nearest overhead barrier is 20-hour resistance at 598.47. That gap is wide enough to matter: if the stock can reclaim resistance, it would show that buyers have absorbed the recent drift and are willing to pay up again. If it fails to hold support, the chart would likely shift from a sideways pause into a more clearly negative structure.
The Bollinger framework sharpens those scenarios. A move back above the 576.10 middle band would signal that price is re-entering the center of its range, while a push toward 598.74 would test whether the squeeze resolves upward. On the other hand, a break below 553.46 would put the lower band in focus and suggest that the recent softness is deepening rather than fading.
Technical Verdict: HOLD (wait & see)
HOLD (wait & see)
- MACD is negative, showing momentum still leans downward even after the day’s gain.
- Price remains below SMA20 at 576.10, so the short-term trend has not been reclaimed.
- Bollinger Bands are squeezing, which signals a possible breakout, but not yet a confirmed direction.
Verdict invalidated if price falls below 559.92, the nearest support, because that would weaken the current stabilization attempt.
- Ideal Entry Range: 559.92 to 568.09
- Exit Target: 576.10 to 598.47
- Stop Loss protection: 553.46
For non-traders, this means the stock is not giving a clean green light or red light yet — it is waiting for a stronger move to show its hand.
“The squeeze is building, but the next break will decide whether this is a pause or a problem.”
Summary Data MA
| Last price | 566.08 USD |
| Change 1 day / 5 days / 1 month | 1.10% / -0.29% / -5.55% |
| Trend / MA-cross | sideways / none |
| SMA20 / SMA50 | 576.10 / 568.09 |
| RSI (14) / Stochastic %K | 47.0 / 31.0 |
| Bollinger %B / ATR | 28% / 8.36 |
| Support / Resistance 20 days | 559.92 / 598.47 |
| Data as of | 24 September 2026 20:30 WIB |


