Golden Cross Formed, PG Stock Gains 0.38% Today
On September 28, 2026: price 146.23 USD, trend uptrend, RSI 50.6, support 142.64, resistance 148.22. technical analysis of pg stock. Golden Cross Formed — full…

Procter & Gamble shares finished at 146.23 USD on 25 September 2026, up 0.38% on the day, but the more important signal is that the stock is still climbing inside a compact trading band. The price is sitting just above both the SMA20 at 146.00 and the SMA50 at 145.97, while the chart shows a golden cross already in place — a technical setup that usually tells traders the short-term average has moved back above the medium-term trend line. In plain English, that means buyers have regained a slight edge, but not a dominant one.
Trend & Price Action
The trend remains labeled uptrend, and the slope of the SMA20 at 0.30% over 5 days confirms that the short-term direction is still pointing higher rather than flattening out. That matters because a rising moving average often acts like a moving floor: when price holds above it, the market is signaling that pullbacks are being absorbed rather than turning into deeper declines. The stock is also trading at 64% of the 20-hour range, which places it in the upper half of its recent band without being stretched to an extreme.
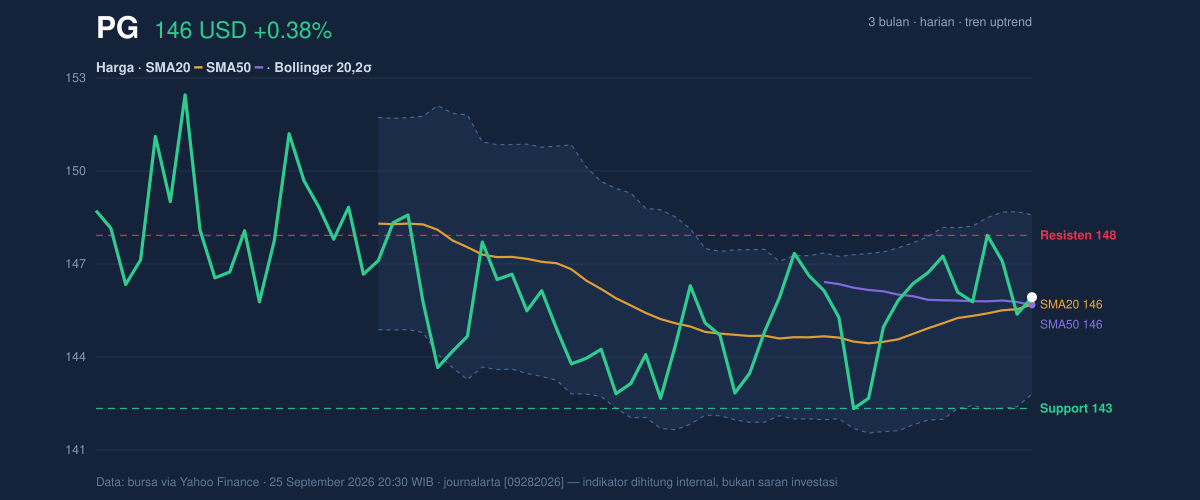
The broader range gives that move context. PG is still below its 3-month high of 154.32 and above its 3-month low of 140.20, which means it is neither breaking out decisively nor testing major downside damage. The important message from the price structure is balance: the market has recovered enough to keep the trend constructive, but it has not yet proven it can push through the next ceiling.
The nearest ceiling is visible.
Oscillators & Momentum
The momentum picture is more restrained than the trend picture. RSI at 50.6 is neutral, which means the stock is not overbought and not oversold; it is sitting right around the point where momentum can either re-accelerate or fade. That neutrality is echoed by Stochastic %K at 59.5 and %D at 63.3, another sign that the stock is moving without a strong momentum imbalance. In other words, the oscillator set does not yet confirm a sharp breakout, but it also does not warn of exhaustion.
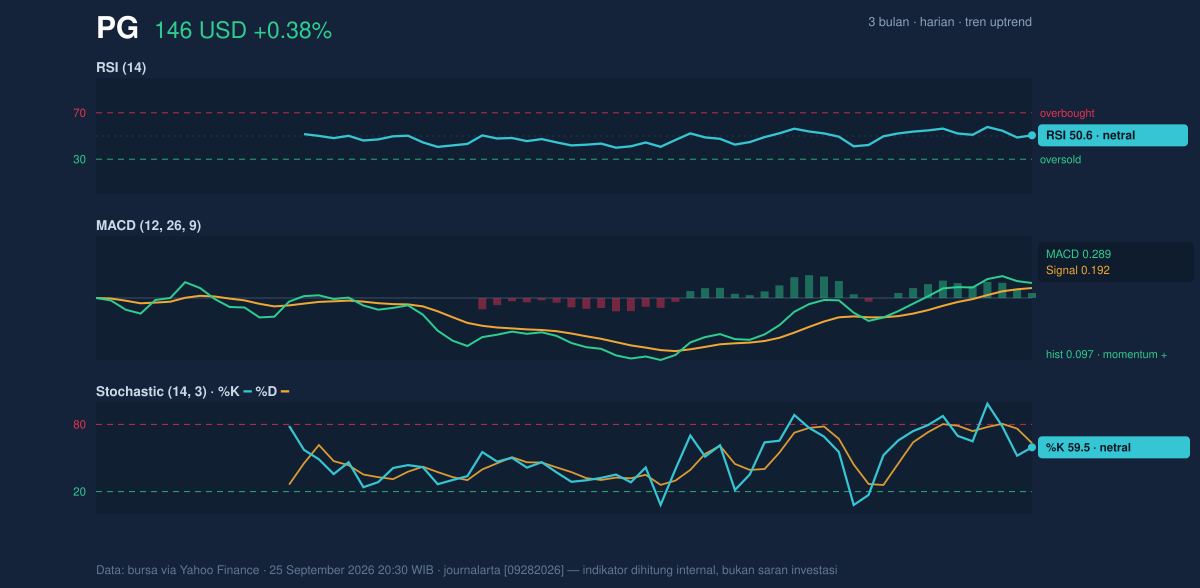
The more encouraging piece is MACD at 0.289 versus signal at 0.192, with a positive histogram of 0.097. That combination suggests the near-term trend has enough internal strength to keep drifting higher, even if the move is not forceful. MACD is useful here because it measures whether recent price action is improving faster than the longer trend; a positive histogram means that improvement is still present. But because RSI and Stochastic remain neutral, the message is not “strong breakout” so much as “quietly constructive.”
Volatility & Volume
Volatility is subdued. ATR at 2.16, or 1.5% of price, points to a low-volatility environment, which often means the stock is coiling rather than trending aggressively. That is reinforced by the Bollinger Band structure: the bands are only 4.0% wide and are squeezing. A squeeze matters because compressed bands often precede a larger directional move; the market is essentially storing energy. With %B at 54%, price is slightly above the band midpoint, showing mild upward bias but not an upper-band breakout.
The volume backdrop is softer. Last volume was 5,790,500 versus a 20-day average of 8,051,950, or about 0.7x normal. That means the latest move higher was not backed by broad participation. In technical terms, price rose, but the crowd did not fully show up. The one positive offset is that OBV is rising, which suggests money flow has still been improving beneath the surface even if the latest session’s turnover was light.
The chart’s squeeze is the key signal now.
Key Levels & Scenarios
The nearest support is 142.64, while resistance stands at 148.22. Those two levels frame the current tradeable range, and the fact that price is closer to resistance than support tells you the market has already recovered much of the recent ground. A push through 148.22 would matter because it would move PG closer to the upper Bollinger band at 148.89 and begin to challenge the idea that this is only a narrow consolidation. If that happens with stronger volume, it would suggest the squeeze is resolving upward.
If the stock fails to hold the area around the moving averages and drifts back toward 142.64, the tone changes quickly. That would imply the golden cross is not yet being respected by traders, and the recent recovery would look more like a pause inside a larger range than the start of a stronger leg higher. The presence of the 3-month low at 140.20 adds a second downside reference: a break toward that zone would signal a much weaker technical backdrop.
Technical Verdict: HOLD (wait & see)
- Reason 1: The golden cross and price above the SMA20/SMA50 keep the trend constructive.
- Reason 2: MACD is positive, but RSI 50.6 and Stochastic 59.5/63.3 are still neutral, so momentum is not yet decisive.
- Reason 3: The Bollinger squeeze and low ATR point to a potential move, but volume at 0.7x normal says confirmation is still missing.
- Invalidation: This verdict is invalidated if price falls below 142.64.
- Ideal Entry Range: 145.97–146.00 or on a confirmed move above 148.22
- Exit Target: 148.89 initially, then 154.32 if resistance gives way
- Stop Loss Protection: 142.64, with deeper technical risk toward 140.20
For non-traders: PG is holding a mild upward bias, but the chart still needs a stronger breakout signal before the move becomes more convincing.
Summary Data PG
| Last price | 146.23 USD |
| Change 1 day / 5 days / 1 month | 0.38% / -0.11% / 2.16% |
| Trend / MA-cross | uptrend / golden |
| SMA20 / SMA50 | 146.00 / 145.97 |
| RSI (14) / Stochastic %K | 50.6 / 59.5 |
| Bollinger %B / ATR | 54% / 2.16 |
| Support / Resistance 20 days | 142.64 / 148.22 |
| Data as of | 25 September 2026 20:30 WIB |

