JPM Stock Gains 1.33%, Death Cross Pressure In Focus
On September 28, 2026: price 343.06 USD, trend downtrend, RSI 41.7, support 337.53, resistance 362.06. technical analysis of jpm stock.

JPMorgan Chase traded at 343.06 dollars on the NYSE on 25 September 2026, up 1.33% on the day, but still sitting below its short- and medium-term trend markers. That matters because the stock is not reacting as if the recent bounce has yet changed the broader structure: price remains under SMA20 at 351.26 and SMA50 at 353.34, while the chart still shows a death cross — the point where the faster average falls below the slower one, often read as a sign that sellers have been in control for long enough to reshape the trend.
Trend & Price Action
The price action is still leaning lower. JPM is in a downtrend, with the SMA20 slope at -0.91% over 5 days, which tells us the recent average price is still drifting down rather than flattening out. The stock’s 1-month change of -3.15% and 5-day change of -1.89% reinforce that the rebound has not yet turned into a sustained recovery.
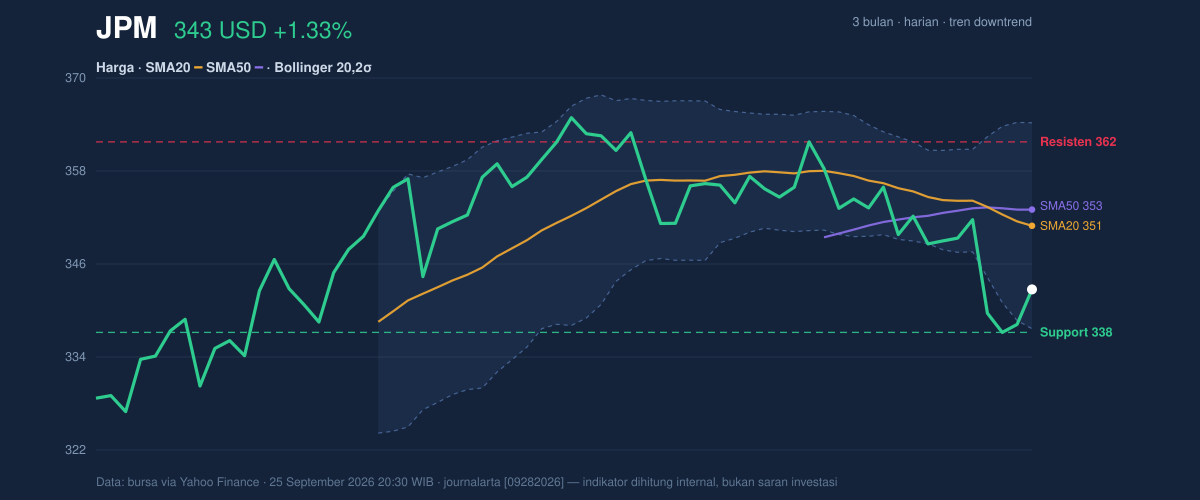
As shown in the chart, the current price is positioned in the lower part of its recent band: JPM is at 23% of the 20-hour range, with 20-hour support at 337.53 and 20-hour resistance at 362.06. That placement is important. It suggests the market is still closer to the floor than the ceiling, but not so close to support that the downside has disappeared. The 3-month high of 366.50 and 3-month low of 325.01 frame the bigger trading zone: the stock is above the low, yet still well below the upper end of the recent range.
The Bollinger Bands add another layer. The lower band is 338.01, almost directly underneath the current price, while the middle band is 351.26 and the upper band is 364.52. JPM is trading with %B at 19%, which means price is near the lower edge of the band structure. In plain terms, the stock is not stretched upward; it is still priced as if the market is cautious. The 7.5% band width also points to a squeeze, or a period of compressed volatility that often precedes a more forceful move. That does not say which direction the move will take, but it does say the current calm could be temporary.
Oscillators & Momentum
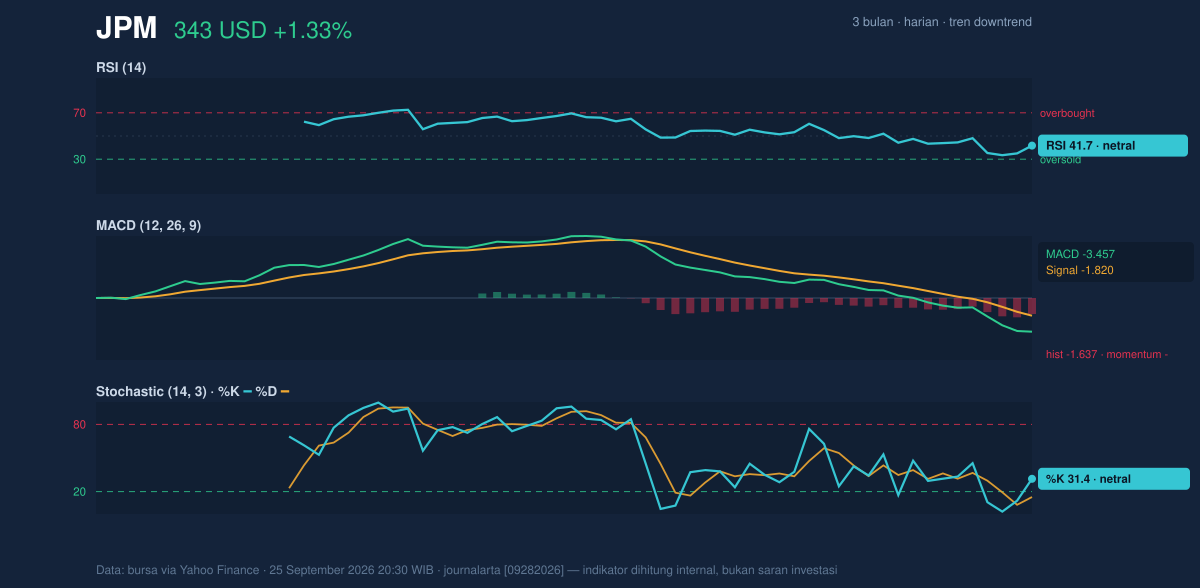
The momentum picture is mixed, and that is exactly why the chart deserves attention. The RSI at 41.7 is neutral, not oversold enough to imply a clear rebound setup and not strong enough to suggest buyers have seized control. The Stochastic %K at 31.4 and %D at 15.1 are also neutral, but the gap between them hints that short-term momentum is trying to improve from weak levels without yet confirming a durable turn.
The bigger warning comes from MACD. JPM’s MACD is -3.457, below the signal line at -1.820, with a histogram of -1.637. That combination means downside momentum is still negative and has not yet been fully repaired by the recent bounce. In practical terms, the stock can rise for a session and still remain under pressure if the momentum lines remain below zero and below their signal reference. That is the current setup here: the rebound exists, but the trend engine is still running weak.
Volatility & Volume
Volatility is moderate rather than extreme. The ATR at 7.15, or 2.1% of price, indicates a stock that can move meaningfully in a day without being disorderly. Combined with the Bollinger squeeze, this suggests the market may be building energy, not relaxing into stability.
Volume gives the move some credibility. The latest volume was 11,460,300, around 1.5× normal versus the 20-hour average of 7,708,480. That matters because higher turnover during a bounce can mean institutions are participating, not just short-term traders. The OBV is rising, which is another constructive sign: on-balance volume rises when volume is accumulating on up days, a clue that demand may be improving even if price has not yet reclaimed the averages. Still, rising OBV alone does not cancel the broader downtrend; it only says participation is getting better.
Key Levels & Scenarios
The immediate map is straightforward. Support sits at 337.53, then the lower Bollinger band at 338.01. Those two levels are almost stacked together, which makes that zone especially important. If JPM holds above that area, the market can keep testing whether the recent bounce has legs. If it fails, the chart points back toward the lower end of the 3-month range, where the prior 325.01 low becomes the next obvious reference.
On the upside, 351.26 is the first major checkpoint because it is both the SMA20 and Bollinger middle band. Reclaiming that area would be more meaningful than a one-day rise because it would show the stock is moving back above the short-term average price. Above that sits 353.34, the SMA50, then 362.06 resistance. A move through those layers would signal that the bounce is no longer just a reaction, but a shift in structure.
Technical Verdict: HOLD (wait & see)
HOLD (wait & see)
- MACD remains negative, with the line below the signal line and a negative histogram, so downside momentum is still active.
- Price is below SMA20 and SMA50, and the chart still shows a death cross, which keeps the broader trend under pressure.
- Volume is supportive and OBV is rising, so the rebound is not empty, but it is not yet strong enough to override the trend damage.
Verdict invalidated if price breaks below 337.53, because that would put JPM beneath the nearest support and the lower Bollinger band area at the same time.
- Ideal Entry Range: 337.53 to 351.26
- Exit Target: 362.06
- Stop Loss protection: below 337.53
In plain English: the stock is trying to stabilize, but the chart still needs proof that the bounce is stronger than the downtrend.
Summary Data JPM
| Last price | 343.06 USD |
| Change 1 day / 5 days / 1 month | 1.33% / -1.89% / -3.15% |
| Trend / MA-cross | downtrend / death |
| SMA20 / SMA50 | 351.26 / 353.34 |
| RSI (14) / Stochastic %K | 41.7 / 31.4 |
| Bollinger %B / ATR | 19% / 7.15 |
| Support / Resistance 20 days | 337.53 / 362.06 |
| Data as of | 25 September 2026 20:30 WIB |

