MRK Momentum Weakens: Stock Gains 0.54% (September 28, 2026)
On September 28, 2026: price 148.78 USD, trend sideways, RSI 56.5, support 143.79, resistance 152.34. technical analysis of mrk stock. MRK Momentum Weakens —…

Merck is holding above short-term support, but the tape still looks more like a pause than a fresh trend, with the stock trading in the middle of a narrowing range as investors wait for the next catalyst.
Merck & Co. shares on the NYSE last changed hands at 148.78 USD, up 0.54% on the day and 1.30% over the past five sessions, according to exchange data cited in Yahoo Finance. That short-term lift matters because it comes while the broader setup remains described as sideways, not decisively trending. In other words, the stock is not breaking down, but it is also not yet showing the kind of sustained directional strength that usually signals a new leg higher. The fact that the price sits above the 20-day SMA at 147.89 and well above the 50-day SMA at 140.38 keeps the longer structure constructive, but the absence of a fresh moving-average crossover means the market has not delivered a new trend confirmation.
The chart shows a stock that is holding its footing, not accelerating.
Trend & Price Action
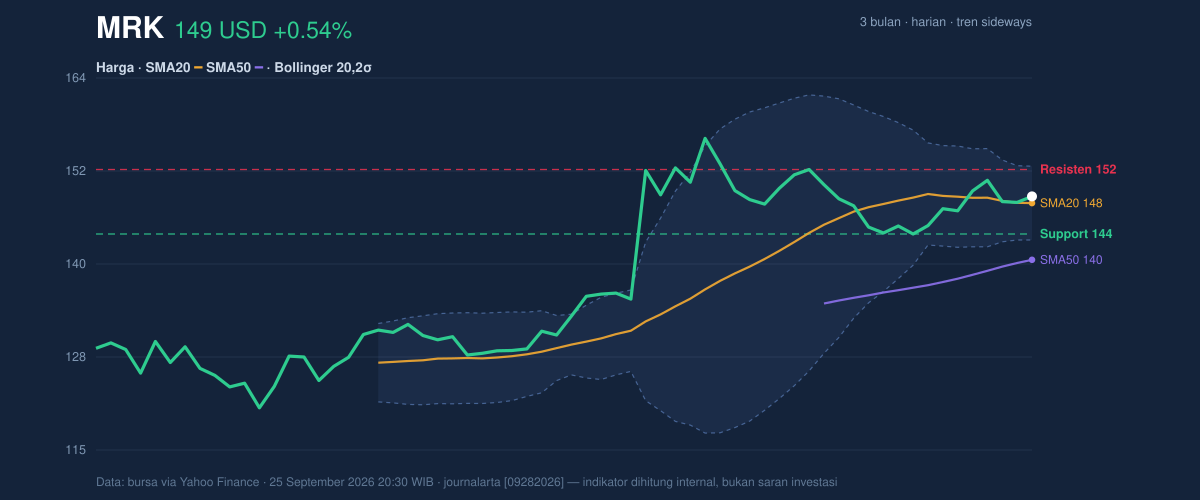
Positionally, Merck is trading above the 20-day average, which usually indicates buyers are still willing to defend recent prices, but the 20-day slope is -0.57% over 5 days, a subtle warning that near-term momentum has softened. That is the key signal in the trend read: price is above the line, but the line itself is still drifting lower. This kind of setup often reflects consolidation after a prior move rather than a clean breakout trend. The stock is also sitting around 58% of its 20-hour range, which places it closer to the upper half of the band but not near the edge where momentum is usually strongest.
The broader range context is also important. Merck’s 3-month high is 156.92 and the 3-month low is 120.16, so the current price is much nearer the upper end of that span than the lower end. That supports the idea that the market is still respecting the recovery built over the past months, even if the latest month shows a modest -0.51% drift.
Oscillators & Momentum
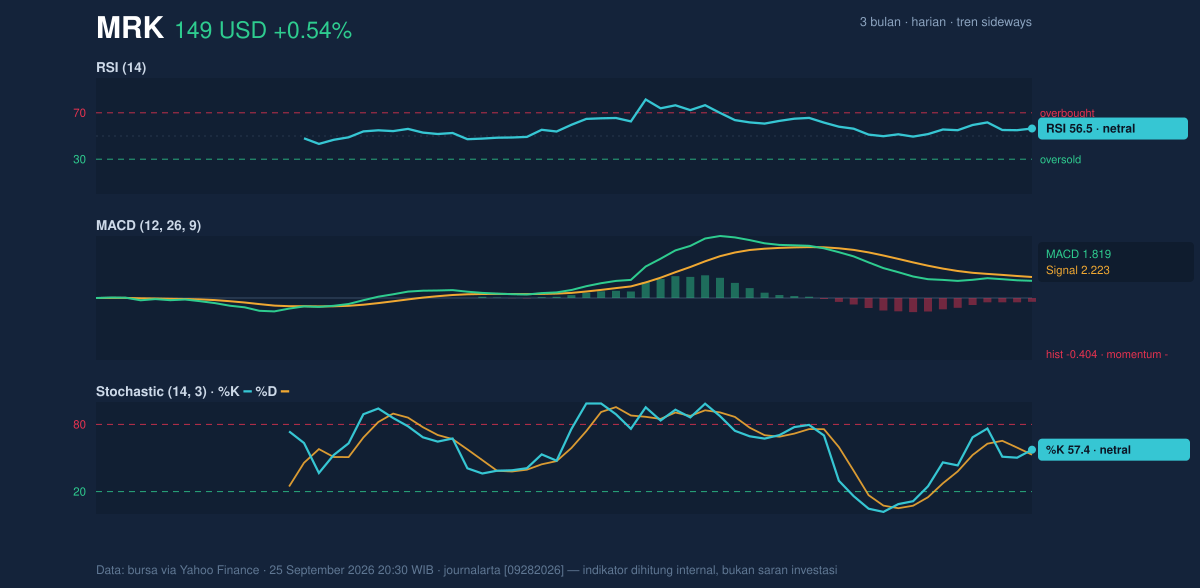
The momentum picture is mixed rather than bullish. RSI at 56.5 is neutral, which means the stock is neither overbought nor oversold and still has room to move either way. Stochastic %K at 57.4 and %D at 53.0 also sit in neutral territory, suggesting the recent bounce has not yet reached an extreme that would usually trigger a reversal warning. That is the good news: there is no sign of an exhausted move.
The less encouraging signal comes from MACD at 1.819 versus signal line 2.223, leaving a -0.404 histogram. In plain language, MACD measures whether the short-term trend is strengthening or fading; here, it says the upward push has lost some force even though price has not broken down. This mismatch between neutral oscillators and a negative MACD histogram is often what a market looks like when it is coiling rather than trending.
Volatility & Volume
The Bollinger structure reinforces that view. Merck’s %B at 59% shows price is trading slightly above the middle of the band, while the bands themselves are relatively tight, with a 6.6% width. A narrowing band often points to a squeeze, meaning volatility has compressed and the stock may be preparing for a larger move. That does not tell direction by itself, but it does tell readers that the current calm may not last.
Volume is not yet confirming a breakout. The latest volume of 8,288,800 shares was only 0.8× normal versus the 20-day average of 9,874,515, and OBV is down. OBV, or on-balance volume, tracks whether volume is flowing in with price or against it; a falling OBV with a stable price often means accumulation is not broad enough to fully validate the bounce. That makes the current advance look more tentative than forceful.
The move is present, but the participation is not.
Key Levels & Scenarios
The market is now boxed in between clearly defined technical levels. On the downside, 143.79 is the nearest 20-hour support, with the Bollinger lower band at 143.00 reinforcing that zone. If that area gives way, the squeeze setup would start to unwind in a less friendly direction. On the upside, 152.34 is the first resistance to clear, closely followed by the Bollinger upper band at 152.77. A move through that cluster would be the cleanest evidence that the squeeze is resolving upward rather than fading back into the range.
Because the price is still between support and resistance, the market is effectively asking whether the current base is a launchpad or just a pause.
Technical Verdict: HOLD (wait & see)
HOLD (wait & see) — the setup is constructive enough to avoid a bearish call, but not strong enough to confirm a breakout.
- Reason 1: Price remains above SMA20 and SMA50, which keeps the medium-term structure intact.
- Reason 2: RSI 56.5 and Stochastic 57.4/53.0 are neutral, showing room for movement without an exhaustion signal.
- Reason 3: MACD histogram -0.404 and OBV down suggest the rebound lacks full momentum and volume confirmation.
- Verdict invalidated if price breaks below 143.79, which would weaken the current support base and challenge the squeeze setup.
- Ideal Entry Range: 143.79 to 147.89
- Exit Target (Target Price): 152.34 to 152.77
- Stop Loss protection: below 143.00
For non-traders, this means Merck is still standing in a stable technical zone, but the chart has not yet shown enough strength to prove the next move is underway.
The next technical test is whether Merck can push through 152.34 and 152.77 or slip back toward 143.79 as the Bollinger squeeze continues to tighten.
Summary Data MRK
| Last price | 148.78 USD |
| Change 1 day / 5 days / 1 month | 0.54% / 1.30% / -0.51% |
| Trend / MA-cross | sideways / none |
| SMA20 / SMA50 | 147.89 / 140.38 |
| RSI (14) / Stochastic %K | 56.5 / 57.4 |
| Bollinger %B / ATR | 59% / 3.29 |
| Support / Resistance 20 days | 143.79 / 152.34 |
| Data as of | 25 September 2026 20:30 WIB |

