Death Cross Pressure, Visa Stock Gains 2.51% Today
On Oktober 6, 2026: price 369.71 USD, trend sideways, RSI 52.7, support 359.33, resistance 375.62. technical analysis of visa stock. Death Cross Pressure —…
By matthew jonathan
October 6, 20264 min read
Death Cross Pressure, Visa Stock Gains 2.51% Today
Yahoo Finance market data put Visa at $369.71 as of October 6, after a 2.51% daily gain from the previous close of $360.66. The rebound has not yet changed the broader technical picture: the stock remains in a sideways trend, trading just above its 20-day average but below a declining 50-day average, while subdued volume and negative MACD point to cautious participation.
Trend & Price Action
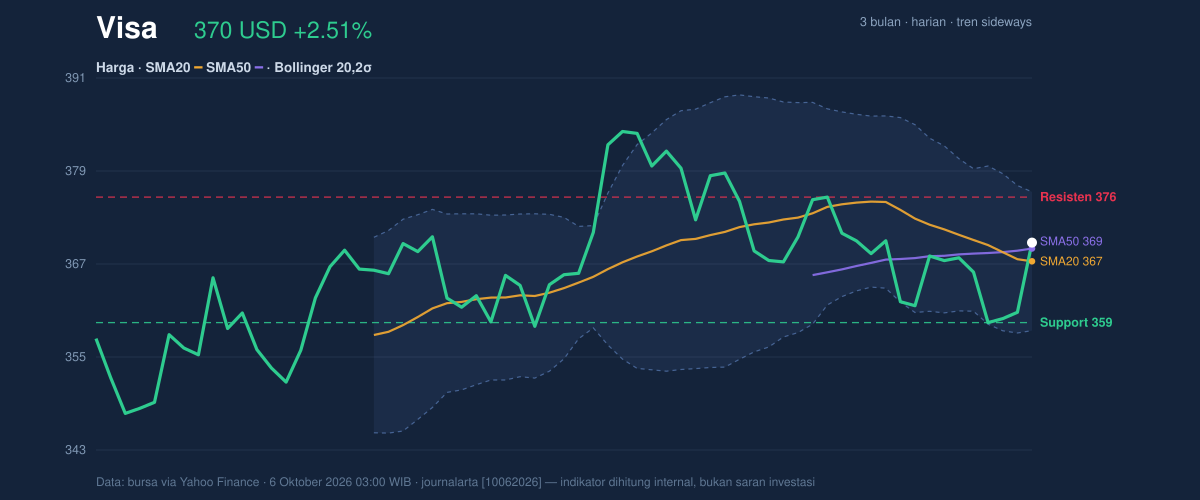
Visa has risen 0.54% over five days but is down 1.43% over the past month. Its last price is above the 20-day simple moving average (SMA) of $367.29, yet sits only slightly above the 50-day SMA of $368.95. The 20-day average has a negative slope, falling 0.93% over five days. That combination suggests a short-term bounce within a market that has not established a durable upward trend.
The averages have formed a death cross: the 20-day SMA moved below the 50-day SMA. This is a bearish signal because it reflects recent price weakness relative to the longer average, but it is not conclusive on its own. Price is currently above both averages, so the latest session offers some counterevidence rather than confirmation of a continued decline.
The stock is at 64% of its 20-session range, between support at $359.33 and resistance at $375.62. Over three months, Visa has traded between $344.42 and $385.57. Its position in the nearer-term range leaves room to test resistance, but the approach is not yet backed by strong volume.
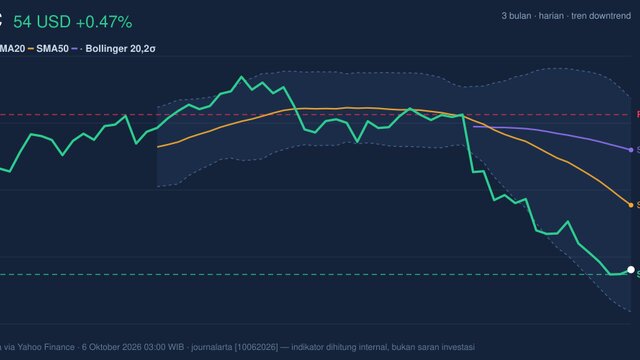
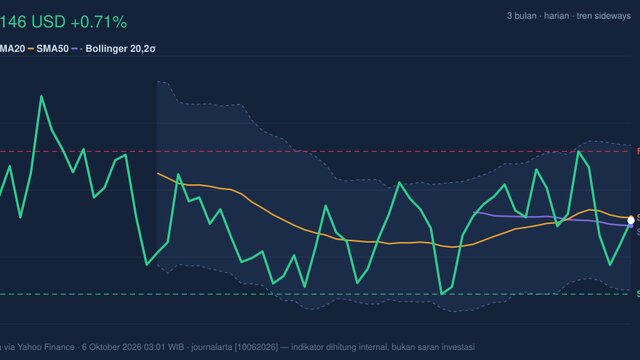
As shown in the chart, the Bollinger Bands—the envelope around the 20-day average—have narrowed to 4.9%, a squeeze that can precede a larger move in either direction. Visa is at 63% of the band’s width, between the $358.28 lower band and $376.29 upper band. The squeeze signals compressed volatility, not the direction of a breakout.3-month price action chart of Visa: price, SMA20/50, Bollinger, support & resistance. Data: exchange via Yahoo Finance.
Oscillators & Momentum
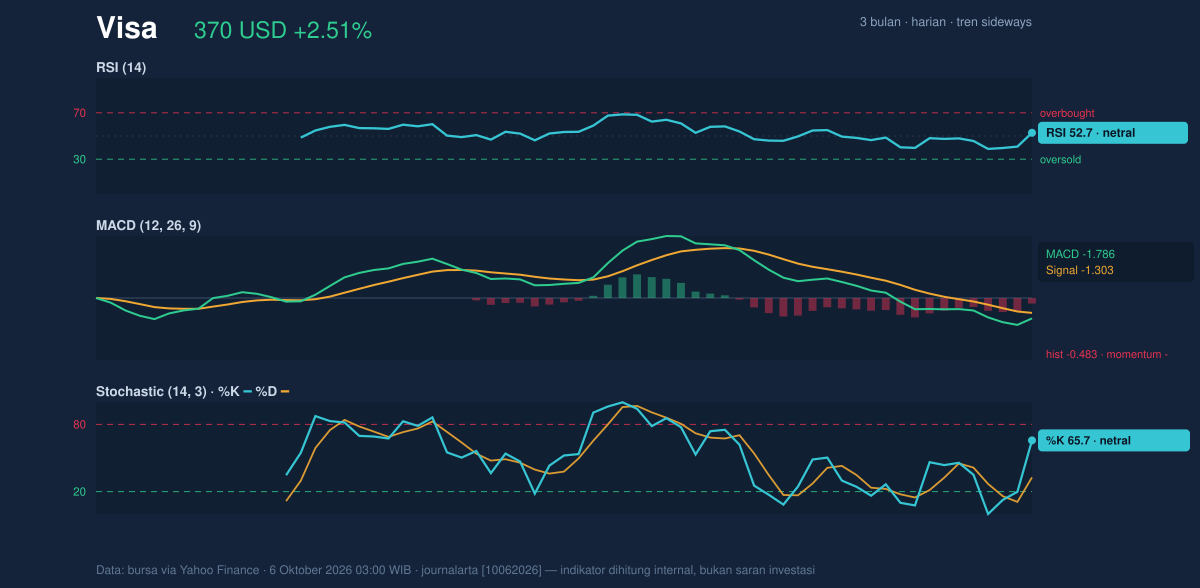
The momentum indicators give a mixed reading. The RSI is neutral at 52.7, meaning recent gains and losses are broadly balanced rather than showing an overbought or oversold extreme. The Stochastic reading is also classed as neutral: %K is 65.7 and %D is 32.7. That spread suggests a stronger short-term reading in %K, but does not by itself confirm a sustained reversal.
MACD, which compares moving averages to gauge momentum, remains negative. Its value is -1.786, below the -1.303 signal line, with a histogram of -0.483. Negative MACD momentum conflicts with the day’s price gain, leaving the rebound without confirmation from this trend-following measure.
Momentum chart of Visa: RSI(14), MACD, Stochastic. Data: exchange via Yahoo Finance.
Volatility, Volume & Scenarios
Average True Range (ATR), a measure of typical daily movement, is $6.20, or 1.7% of the share price, indicating moderate volatility. That makes the narrow Bollinger Bands notable: a squeeze alongside moderate ATR points to unusually compressed recent trading relative to typical movement, but the next move still depends on whether buyers or sellers gain control.
Volume was 4,523,500 shares, about 0.7 times the 20-session average of 6,123,915. On-balance volume (OBV), which tracks whether volume is flowing more with gains or losses, is declining. The low-volume rise therefore carries limited evidence of broad buying participation.
A break above the $375.62 resistance would strengthen the case that the rebound is extending; the upper Bollinger Band at $376.29 is another nearby reference. Failure to hold the $359.33 support would weaken the short-term structure, with the lower band at $358.28 also relevant. Those are conditional scenarios, not forecasts.
Technical Verdict: HOLD
The indicators support a wait-and-see assessment rather than a decisive directional signal. RSI is neutral, the price is slightly above both moving averages, but the death cross and negative MACD remain headwinds. Declining OBV and below-average volume also leave the latest gain weakly confirmed.
Ideal entry range: $359.33–$367.29, using 20-session support and the 20-day SMA as reference levels.
Exit target: $375.62–$376.29, spanning 20-session resistance and the upper Bollinger Band.
Stop-loss protection: $358.28, at the lower Bollinger Band.
The verdict is invalidated if the price falls below $359.33, because that would break the stated 20-session support.
For non-traders, the signals are mixed: Visa has bounced, but the evidence is not yet strong enough to show that the recovery is established.
Data
Source: exchange data via Yahoo Finance, as of October 6, 2026, 03:00 WIB. Technical indicators describe historical price and volume patterns and do not guarantee future performance.