KO Stock Gains 1.00% Today, Death Cross Pressure
On Oktober 6, 2026: price 86.51 USD, trend downtrend, RSI 43.7, support 85.65, resistance 89.35. technical analysis of ko stock. KO Stock Gains — full details…
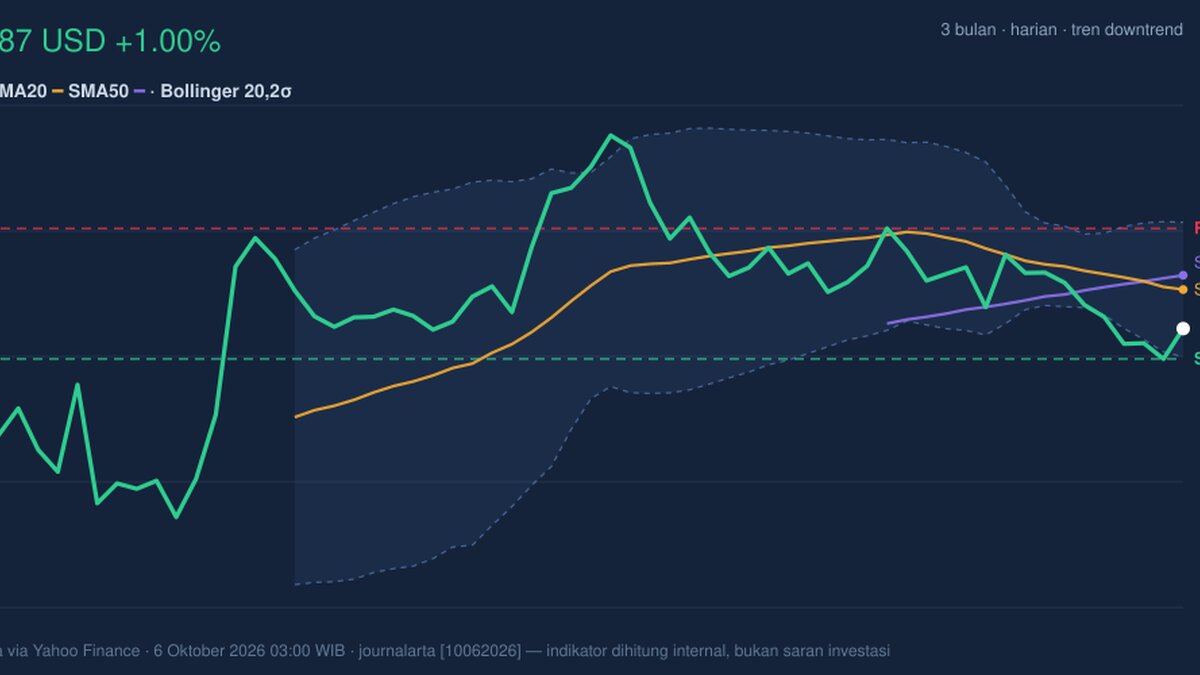
Coca-Cola closed at $86.51 on Oct. 6, up 1.00% on the day but still below its short- and medium-term trend averages. The session’s gain has not yet overturned a broader weakening pattern: the stock is down 0.77% over five days and 1.77% over a month. Data from the exchange via Yahoo Finance show price pressure alongside negative momentum, even as trading volume ran above its recent average.
Trend & Price Action
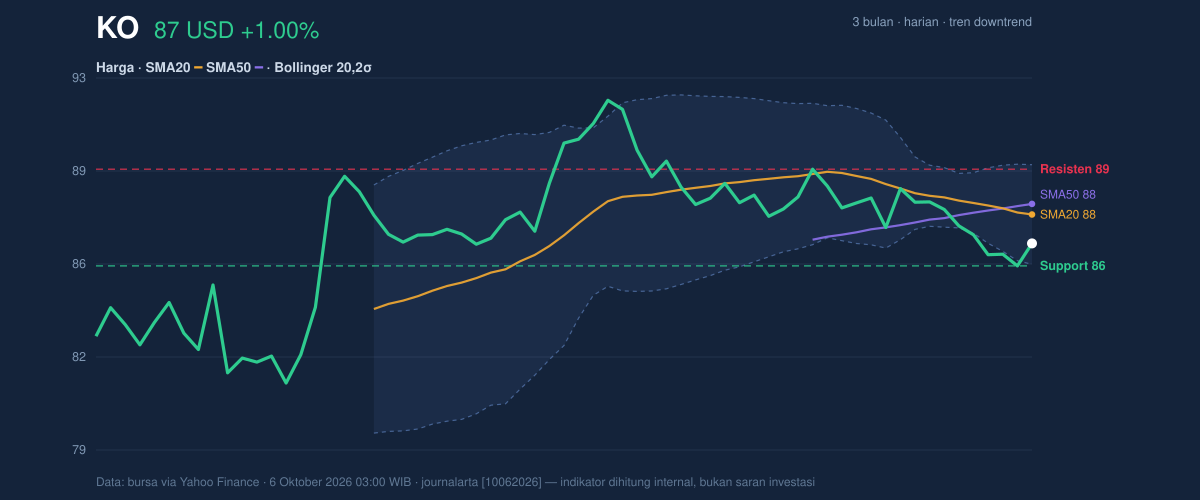
KO remains below its 20-day simple moving average (SMA) of $87.62 and its 50-day SMA of $88.02. The 20-day average is sloping down, and a death cross—the shorter average moving below the longer one—confirms that recent price action has weakened relative to the preceding trend. A one-day rise is therefore a bounce within a declining structure, not yet a confirmed reversal.
The price is near the lower end of its recent trading range: it sits at 23% of the span between 20-session support at $85.65 and resistance at $89.35. The three-month range, from $80.83 to $92.49, puts the current price above the period’s low but well short of its high. That positioning suggests sellers have the near-term advantage, though the stock is not at its three-month trough.
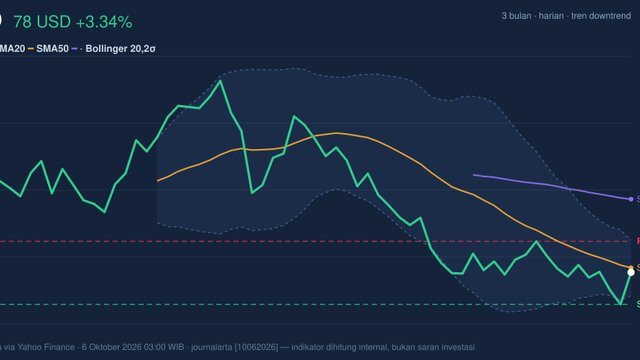
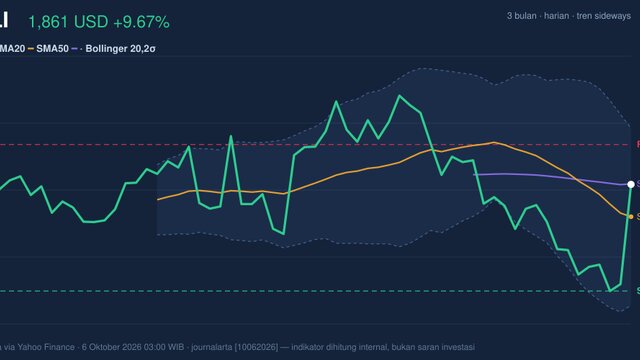
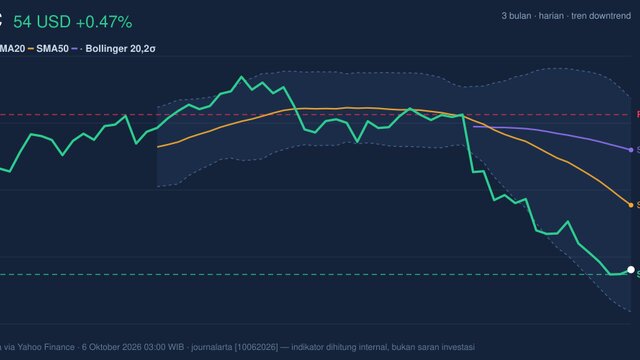
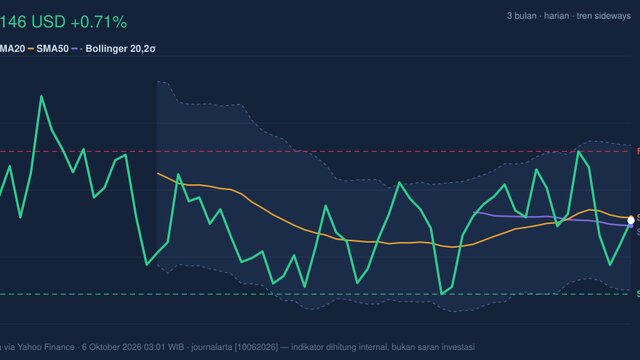
The chart makes the nearby barriers clear.
Oscillators & Momentum
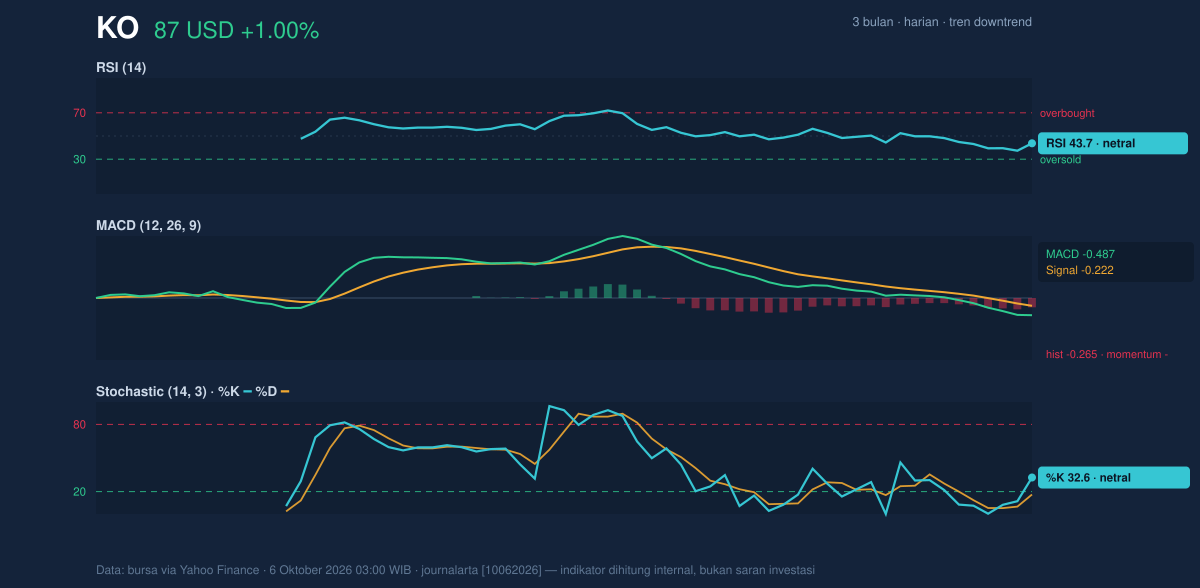
The RSI is 43.7, a neutral reading, indicating neither an oversold condition nor strong upside momentum. The Stochastic readings—%K at 32.6 and %D at 17.4, also neutral—show some recovery from weaker territory, but do not by themselves establish a durable change in direction.
MACD gives the more cautious signal. At -0.487, below its -0.222 signal line, with a negative histogram of -0.265, it points to downside momentum still outweighing any improvement in the shorter-term oscillators. The indicators are not in outright capitulation territory; rather, they describe a stock attempting to stabilize without clear confirmation that sellers have stepped aside.
That distinction matters.
Volatility & Volume
Bollinger Bands place KO closer to the bottom of its recent volatility envelope: the lower band is $85.71, the middle band $87.62 and the upper band $89.53. A %B reading of 21% means price is in the lower portion of that band, consistent with recent weakness. At the same time, band width is just 4.4% and narrowing, a Bollinger squeeze. A squeeze signals that trading has become compressed and a larger move may follow, but it does not say which direction that move will take.
Average True Range, a measure of typical daily price movement, is $1.14, or 1.3% of the share price—low volatility by this measure. Volume was 21,274,700 shares, about 1.3 times the 20-session average of 16,033,595. Higher-than-usual participation gives the day’s move more weight, but falling On-Balance Volume (OBV), which tracks whether volume has generally accompanied buying or selling, remains a warning that accumulation has not been established.
Key Levels & Scenarios
The first test is $85.65 support, close to the lower Bollinger Band at $85.71. Holding that area would keep the recent range intact and could leave room for a move toward the moving averages. A sustained break below support would weaken the short-term structure and expose the broader range toward its three-month low of $80.83. On the upside, $87.62–$88.02 is a resistance zone formed by the 20- and 50-day averages; clearing it would be an initial sign of repair, while $89.35–$89.53 is the next notable barrier, where range resistance meets the upper band.
Technical Verdict: HOLD (wait & see)
The technical picture is cautious but not decisive: weak trend and MACD argue against calling a reversal, while neutral oscillators and nearby support leave room for stabilization. The verdict rests on three signals: the death cross and falling 20-day average show a deteriorating trend; MACD remains negative; and price is close to support as Bollinger Bands tighten, making a directional break possible. The verdict is invalidated if price falls below $85.65.
- Illustrative entry range: $85.65–$87.62, bounded by 20-session support and the 20-day SMA.
- Illustrative exit target: $89.35–$89.53, around range resistance and the upper Bollinger Band.
- Illustrative stop-loss protection: below $85.65, using the stated support level as the threshold.
In plain English, KO is trying to steady itself, but its trend has not yet turned convincingly higher.
Summary Data KO
| Last price | 86.51 USD |
| Change 1 day / 5 days / 1 month | 1.00% / -0.77% / -1.77% |
| Trend / MA-cross | downtrend / death |
| SMA20 / SMA50 | 87.62 / 88.02 |
| RSI (14) / Stochastic %K | 43.7 / 32.6 |
| Bollinger %B / ATR | 21% / 1.14 |
| Support / Resistance 20 days | 85.65 / 89.35 |
| Data as of | 6 Oktober 2026 03:00 WIB |
Track KO stock price daily: live levels, support/resistance and our full KO analysis history.