MA Stock Technicals Today: Gains 2.23%, Death Cross Pressure
On Oktober 6, 2026: price 564.59 USD, trend sideways, RSI 49.3, support 550.00, resistance 574.42. technical analysis of ma stock. MA Stock Technicals — full…
By matthew jonathan
October 6, 20264 min read
MA Stock Technicals Today
Mastercard rose 2.23% to $564.59 on Oct. 6, recovering from the previous close of $552.26, according to exchange data via Yahoo Finance. But the daily gain sits against a softer longer-term picture: the stock is down 0.65% over five days and 2.52% over a month, while its short-term average remains below its longer-term average. The move looks more like a rebound within a sideways market than a confirmed trend change.
Trend & Price Action
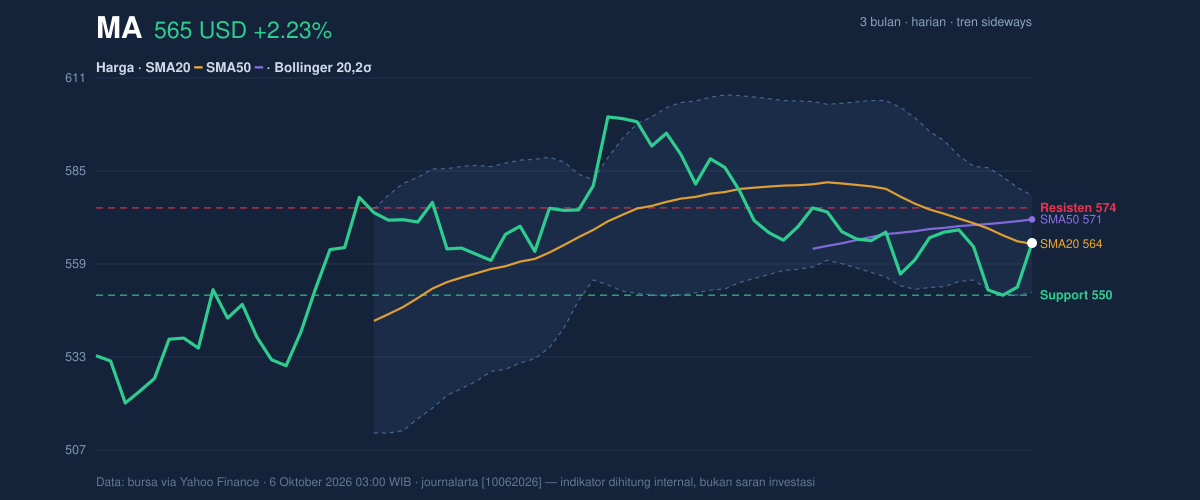
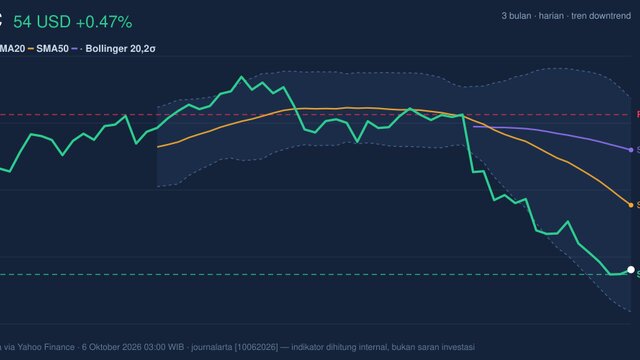
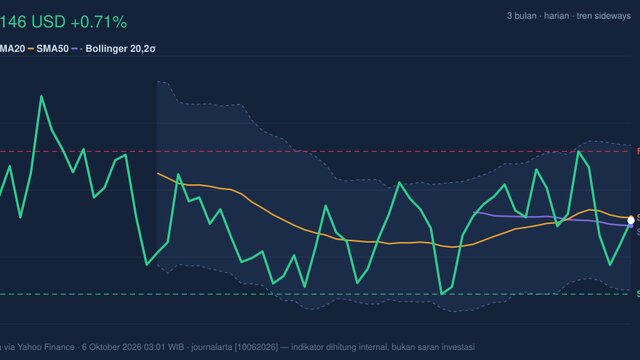
Mastercard is trading just above its 20-day simple moving average (SMA) of $564.34, but remains below its 50-day SMA of $571.20. The 20-day average has declined 1.24% over five days, and its move below the 50-day average—a death cross—signals that recent price weakness has outweighed the medium-term trend. That is a caution flag, not a guarantee of further declines.
The price is around 60% of its recent 20-day range, between $550.00 support and $574.42 resistance. It is also well within its three-month high of $601.23 and low of $515.11, underscoring that the stock has retreated from its peak without approaching its broader-period low.
The narrow trading band suggests the market may soon make a more decisive move, but not which way.
3-month price action chart of MA: price, SMA20/50, Bollinger, support & resistance. Data: exchange via Yahoo Finance.
Oscillators & Momentum
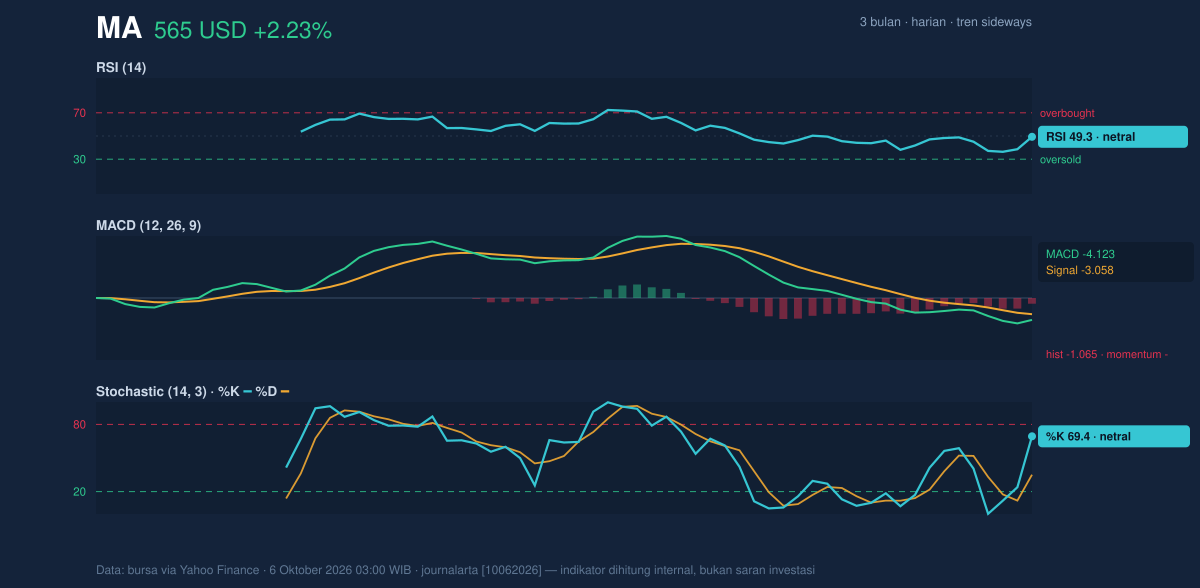
Momentum indicators offer a mixed reading. The RSI is 49.3, a neutral reading, indicating neither strong buying pressure nor an oversold condition. The Stochastic oscillator, which compares the latest price with its recent trading range, is also categorized as neutral: %K is 69.4 and %D is 35.1. The gap between the two lines can signal a change in short-term momentum, but does not establish one by itself.
The MACD, a trend-following measure, remains below its signal line: -4.123 versus -3.058, with a histogram of -1.065. That negative MACD configuration points to momentum still leaning downward, despite the latest session’s gain. Together, neutral RSI and Stochastic readings alongside negative MACD suggest a market that has stabilized temporarily but has not yet produced broad momentum confirmation.
Momentum chart of MA: RSI(14), MACD, Stochastic. Data: exchange via Yahoo Finance.
Volatility, Bands & Volume
The Bollinger Bands—an indicator that plots a typical trading envelope around the price—run from $550.75 to $577.92, with the middle band at $564.34. Mastercard’s price is near that midpoint, and the %B reading of 51% places it almost halfway between the lower and upper bands. The band width is 4.8% and narrowing, a Bollinger squeeze that points to compressed volatility and the potential for a breakout. A squeeze is a warning of possible expansion, not a directional signal.
Average true range (ATR), a measure of typical price movement, is $9.47, or 1.7% of the share price, indicating moderate volatility. Trading volume was 2,404,800 shares, about 0.9 times the 20-day average of 2,785,000. The lower-than-normal participation tempers the significance of the daily advance, although rising on-balance volume (OBV)—a cumulative measure that relates volume to price direction—suggests buying pressure has been building beneath the surface.
Key Levels & Scenarios
The $574.42 resistance area is close to the 50-day average, making it a meaningful test: a sustained move above both would weaken the bearish message from the death cross and negative MACD. If the stock fails there, attention returns to $550.00 support, which sits near the $550.75 lower Bollinger Band. A break below that zone would indicate the recent range is giving way on the downside.
As shown in the chart, the squeeze leaves room for a sharper move once price exits its current band. With the stock near the middle of the range, confirmation from price and volume matters more than the single-session jump.
Technical Verdict: HOLD
The indicators support a wait-and-see reading: Mastercard is above its 20-day average and OBV is rising, but it remains below its 50-day average, the death cross is in place, and MACD momentum is negative. The verdict is invalidated if price falls below $550.00 support.
- Indicative entry range: $550.75–$564.34, based on the lower Bollinger Band and 20-day average.
- Indicative exit target: $574.42–$577.92, based on resistance and the upper Bollinger Band.
- Indicative stop-loss protection: Below $550.00, the stated 20-day support.
For non-traders, HOLD means the signals are mixed and the next move needs clearer confirmation.
Market data: Exchange data via Yahoo Finance, as of Oct. 6, 2026, 03:00 WIB. Technical indicators describe historical price and volume behavior and are not a recommendation.