Momentum Weakens, DIS Stock Gains 1.39% Today
On Oktober 6, 2026: price 103.61 USD, trend sideways, RSI 46.9, support 101.33, resistance 108.59. technical analysis of dis stock. Momentum Weakens — full…
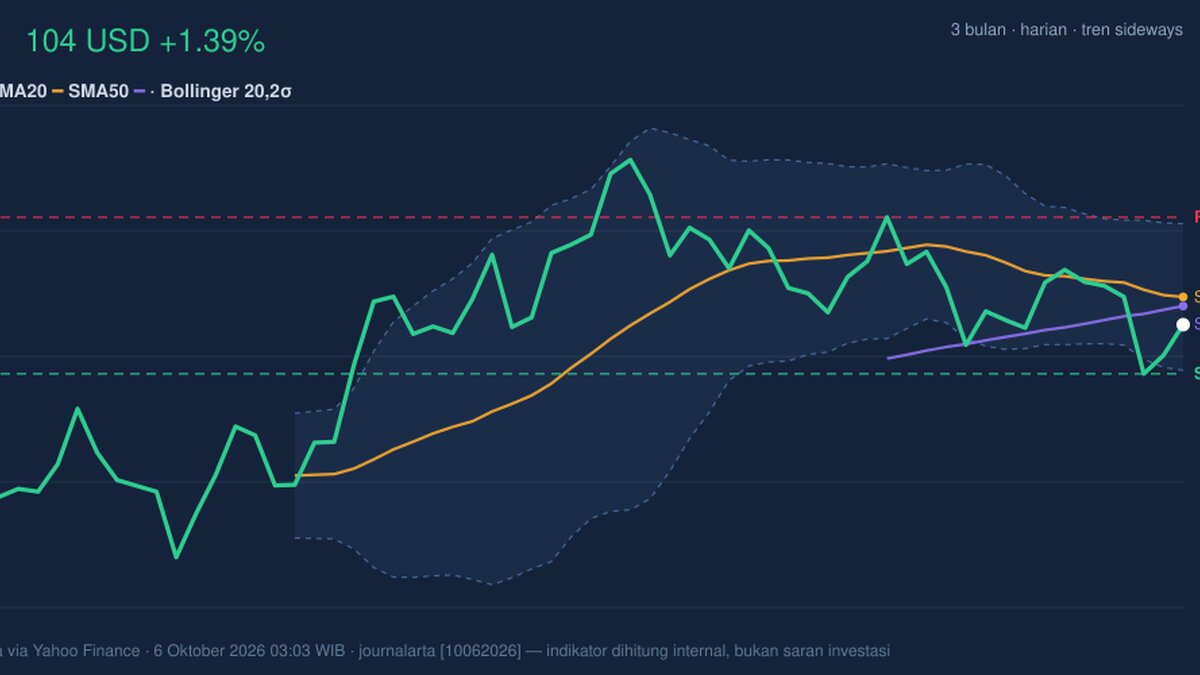
DIS rose 1.39% to $103.61 on Oct. 6, but the daily gain has not yet reversed its softer short-term trend. The stock remains below both its 20-day and 50-day moving averages, while declining on the five-day and one-month measures. That combination points to a share price trying to steady, rather than a confirmed recovery. Data are from exchange trading via Yahoo Finance, as of 03:03 WIB.
Trend & Price Action
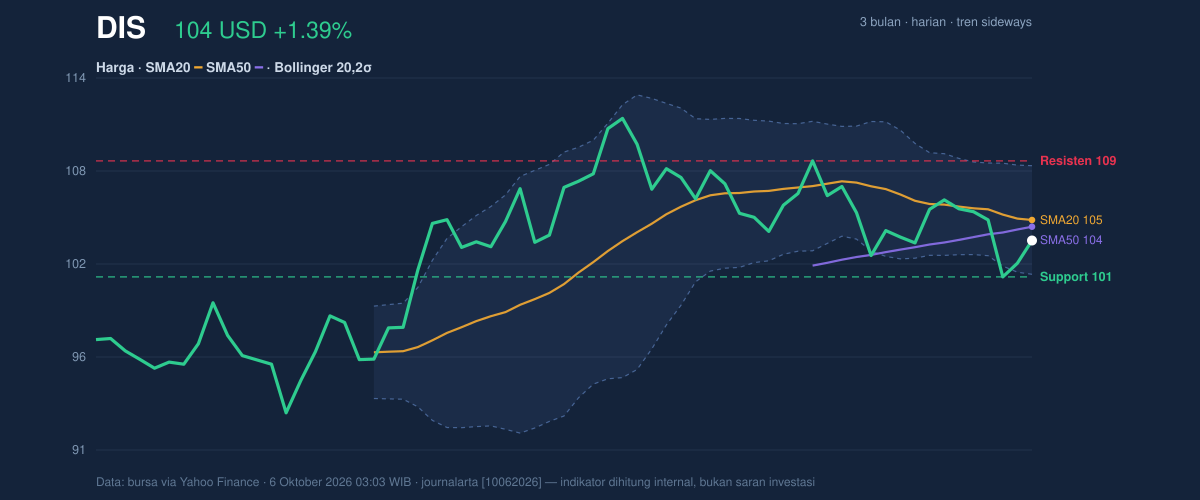
Disney’s shares are in a sideways trend, with the 20-day simple moving average (SMA) sloping down 0.79% over five days. At $103.61, DIS is below its 20-day SMA of $104.89 and 50-day SMA of $104.47. Neither average has recently crossed the other, so there is no fresh “golden cross” (a shorter-term average moving above a longer-term one) or “death cross” to signal a decisive trend change.
The gap between price and those averages is modest, but it matters: the shares have not yet reclaimed the levels that would suggest buyers are consistently taking control. The 3-month range, from $92.49 to $111.87, shows the stock remains well above its low, but below its high.
The latest rise is a rebound, not yet trend confirmation.
The chart places the price near the lower portion of its recent trading range. The 20-day Bollinger Bands—bands that widen or contract with price volatility—run from $101.50 to $108.29. DIS is at 31% of that band, meaning it is closer to the lower boundary than the upper one. As shown in the chart, the nearby averages and bands frame the levels the stock would need to reclaim to strengthen its short-term picture.
Oscillators & Momentum
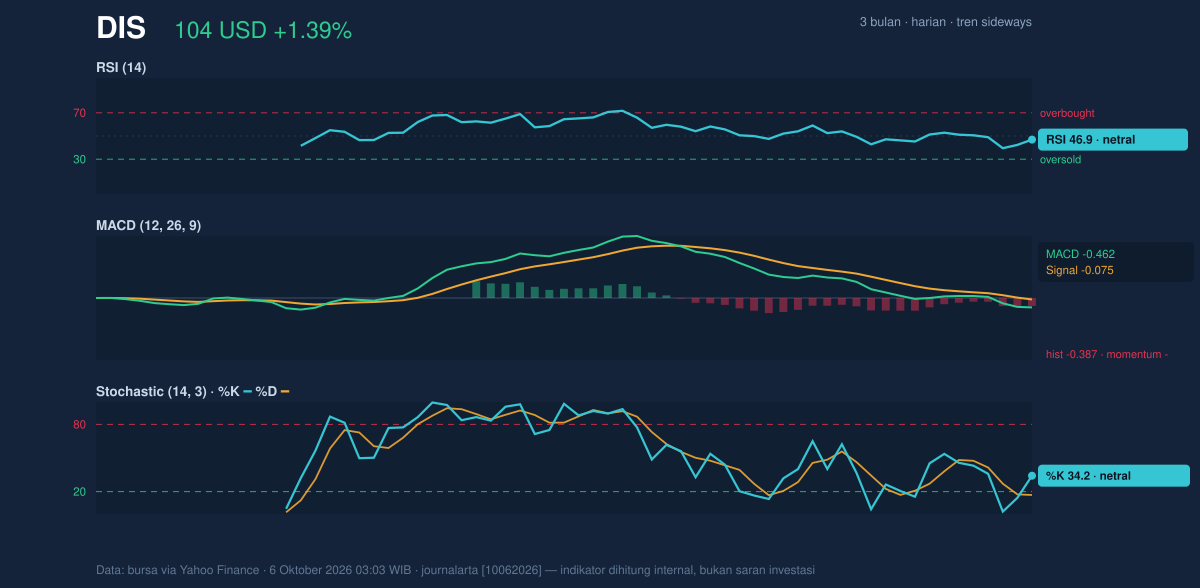
Momentum readings are mixed, but lean weak. The RSI is 46.9, a neutral reading on a scale commonly used to gauge whether a stock has been bought or sold too aggressively. It does not indicate an oversold extreme that would, by itself, imply a rebound is due.
The Stochastic reading is also classed as neutral, with %K at 34.2 and %D at 17.0. The difference between the two lines can signal a change in short-term momentum, but it is not enough to establish a reversal without price confirmation. More clearly, the MACD is negative at -0.462, below its -0.075 signal line, with a -0.387 histogram. MACD compares shorter- and longer-term price momentum; a negative reading below the signal line indicates downward momentum remains in place.
That matters because the one-day rise has not been backed by a turn in the broader momentum measures.
Volatility, Volume & Key Levels
The Bollinger Band width is 6.5% and narrowing, a squeeze that means recent price movement has become more contained. A squeeze can precede a larger move, but it does not predict which direction that move will take. With price at 31% of the band and MACD still negative, a break above resistance would be more convincing evidence of improving momentum than the squeeze alone.
The average true range (ATR), a measure of typical daily price movement, is $2.07, or 2.0% of the share price: moderate volatility. Trading volume was 7,037,600 shares, about 0.8 times the 20-day average of 8,709,370, while on-balance volume (OBV)—a running measure that adds or subtracts volume according to price direction—was falling. The light volume and declining OBV suggest the latest gain has not yet attracted strong participation.
Support sits at $101.33; resistance is $108.59. If DIS holds support, the shares could continue consolidating within that range. A move through resistance would put the $108.29 upper Bollinger Band in view, though holding above the 20-day average would also be important. If support gives way, the setup weakens, with the lower Bollinger Band at $101.50 offering a nearby reference rather than assurance of a floor.
Technical Verdict: HOLD (wait & see)
Core technical reading: HOLD (wait & see), as a one-day gain has not overcome weak momentum and below-average participation. The main reasons are the negative MACD, the price below both short- and medium-term averages, and falling OBV on volume below its 20-day average. The narrowing Bollinger Bands leave room for a larger move, but do not resolve its direction.
- Ideal entry range: $101.50–$104.89, spanning the lower Bollinger Band and 20-day SMA.
- Exit target: $108.29–$108.59, around the upper Bollinger Band and 20-hour resistance.
- Stop-loss reference: $101.33, the 20-hour support level.
- Invalidation: The hold-and-wait reading is invalidated if price falls below $101.33.
In plain English, the chart is not yet showing enough evidence that Disney’s recent rise has become a sustained recovery.
| Indicator | Reading |
|---|---|
| Last price | $103.61 |
| Daily change | +1.39% |
| 20-day / 50-day SMA | $104.89 / $104.47 |
| RSI (14) | 46.9, neutral |
| MACD / signal / histogram | -0.462 / -0.075 / -0.387 |
| Bollinger Bands / %B | $101.50–$108.29 / 31% |
| Support / resistance | $101.33 / $108.59 |
| ATR (14) | $2.07 |
| Volume / 20-day average | 7,037,600 / 8,709,370 |
Summary Data DIS
| Last price | 103.61 USD |
| Change 1 day / 5 days / 1 month | 1.39% / -1.88% / -1.61% |
| Trend / MA-cross | sideways / none |
| SMA20 / SMA50 | 104.89 / 104.47 |
| RSI (14) / Stochastic %K | 46.9 / 34.2 |
| Bollinger %B / ATR | 31% / 2.07 |
| Support / Resistance 20 days | 101.33 / 108.59 |
| Data as of | 6 Oktober 2026 03:03 WIB |
Track DIS stock price daily: live levels, support/resistance and our full DIS analysis history.