Tencent Testing Support Level: Stock Gains 0.43% (Oktober 6, 2026)
On Oktober 6, 2026: price 423.00 HKD, trend downtrend, RSI 41.9, support 419.00, resistance 451.60. technical analysis of tencent stock.
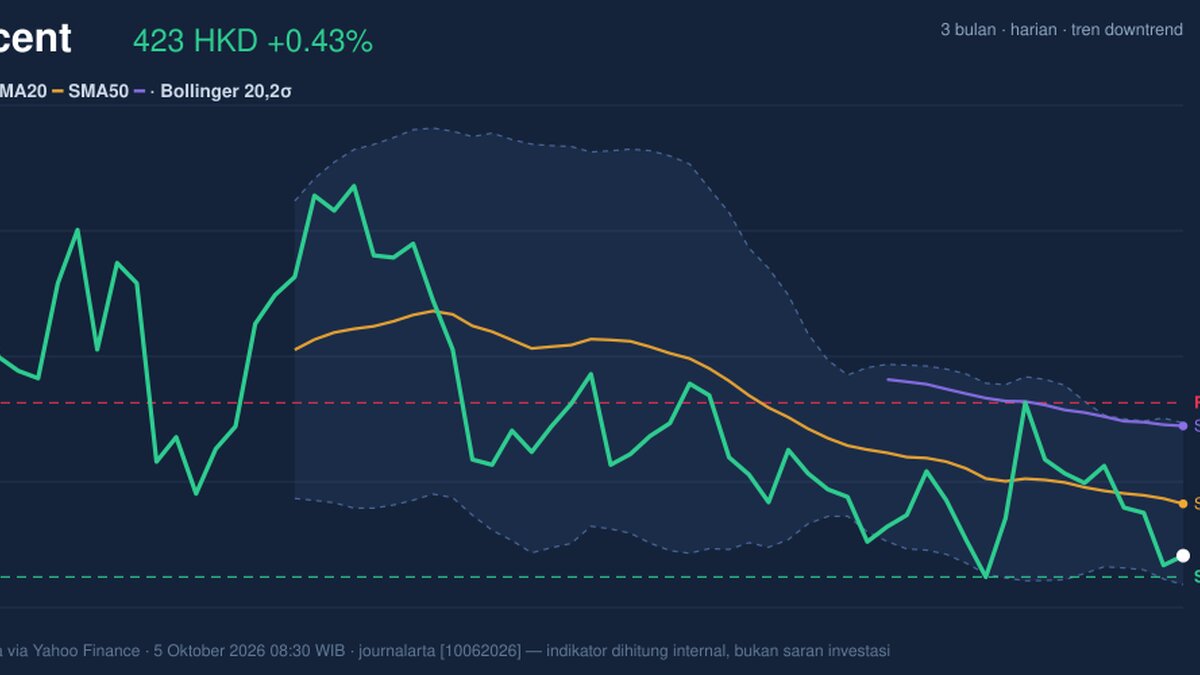
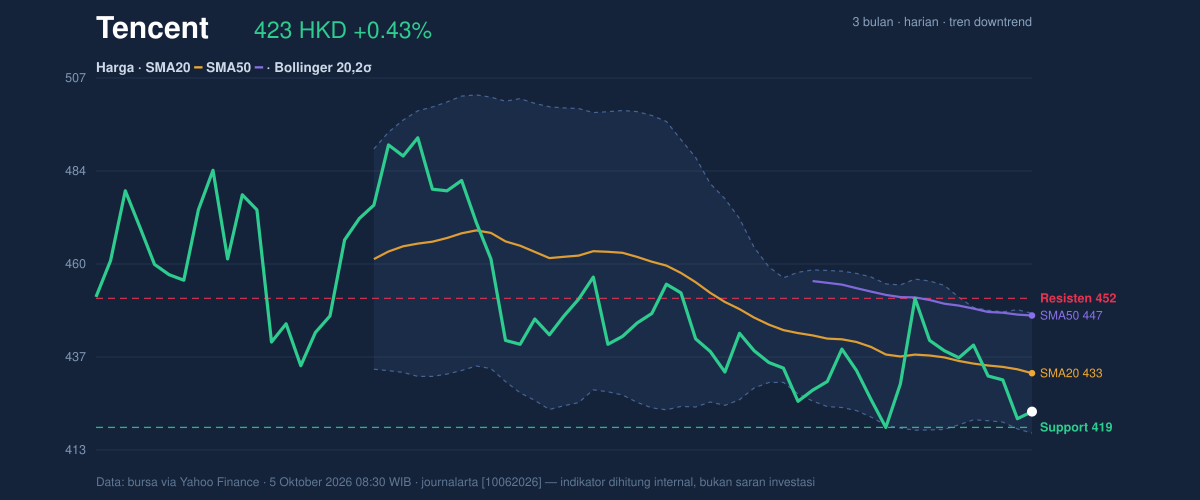
Tencent Holdings rose 0.43% to HK$423.00 on the Hong Kong exchange, but the small daily gain did little to reverse a broader slide: the stock was down 3.11% over five sessions and 4.47% over one month, according to market data from the exchange via Yahoo Finance as of October 5, 2026. The price remains below both its 20-day and 50-day moving averages, suggesting buyers have yet to change the prevailing downward trend.
Trend & Price Action
At HK$423.00, Tencent trades below its 20-day average of HK$432.71 and its 50-day average of HK$447.28. The 20-day average is falling, down 0.70% over five sessions, while no new moving-average crossover has formed. That combination points to continued weakness rather than a confirmed trend reversal: a crossover occurs when a shorter-term average moves through a longer-term one, and none has offered a fresh directional signal here.
The stock sits near the lower end of its 20-session range, only 12% of the way from support at HK$419.00 to resistance at HK$451.60. Its three-month range—from HK$416.40 to HK$497.80—also shows how far it has retreated from recent highs. The price structure remains bearish until Tencent can reclaim its short-term average and sustain a move higher.
The Bollinger Bands, which map recent price variation around an average, run from HK$417.57 to HK$447.85, with a midpoint of HK$432.71. Tencent’s position at 18% of the band’s width places it close to the lower boundary. The bands have narrowed to 7.0%, a squeeze that signals reduced recent volatility and the potential for a larger move, but does not indicate which direction it will take.
Oscillators & Momentum
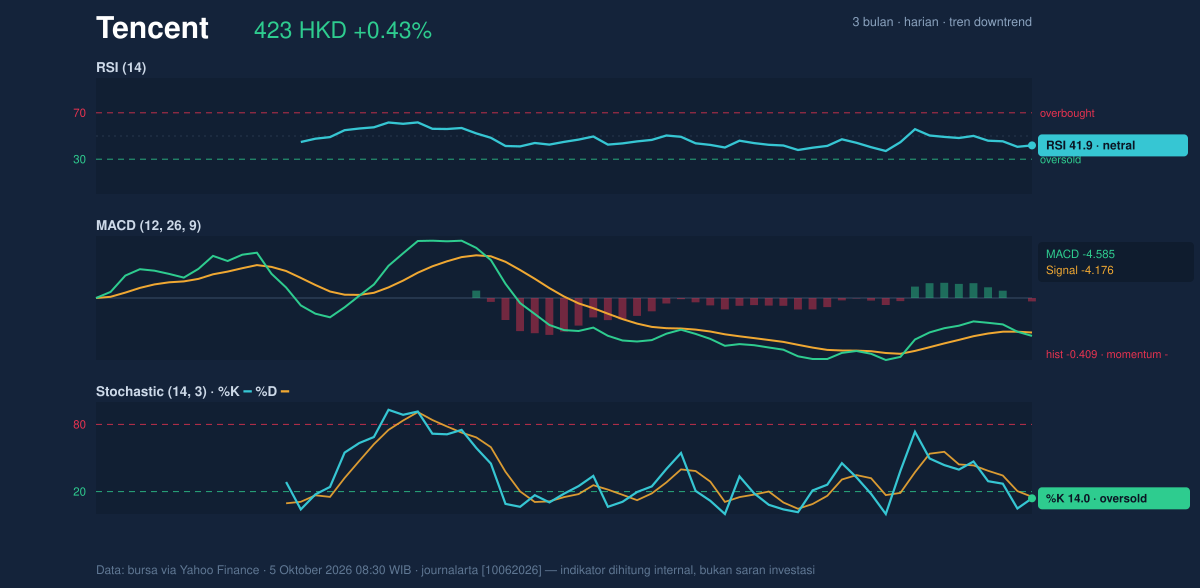
Momentum indicators are mixed, but the balance still leans weak. The 14-day RSI is 41.9, a neutral reading below the midpoint that is consistent with subdued buying pressure rather than a deeply oversold market. The Stochastic reading, which compares the latest close with its recent trading range, is more stretched: %K at 14.0 and %D at 15.3 are in oversold territory. That can precede a bounce, but oversold conditions alone do not establish that a decline has ended.
The MACD is below its signal line, with a negative histogram of -0.409. In plain terms, the short-term momentum measure remains weaker than its own trend line, reinforcing the downtrend rather than confirming a turn. The oversold Stochastic offers a possible early stabilisation signal, but the negative MACD has not confirmed it.
Volatility, Volume & Key Levels
Average true range, a measure of typical daily price movement, is HK$12.04, or 2.8% of the share price—moderate volatility. With the Bollinger Bands compressed, a break from the recent trading area could carry more force than the latest quiet session suggests. Yet participation was thin: volume of 8,709,438 shares was about 0.4 times the 20-session average of 19,359,173. OBV, which tracks the balance of volume on rising and falling sessions, is rising; that divergence may hint at accumulation, but light turnover limits its confirmation.
HK$419.00 is the immediate support to watch, close to the three-month low of HK$416.40 and the lower Bollinger Band at HK$417.57. A hold could allow a technical bounce, particularly if volume improves; a sustained break below support would weaken that case and expose the stock to further downside. On the upside, resistance at HK$451.60 sits above the 50-day average and the upper Bollinger Band. Reclaiming the 20-day average at HK$432.71 would be an initial sign of repair, but it would not by itself clear the higher barrier.
Technical Verdict: HOLD
The indicators support a wait-and-see reading rather than a clear directional signal. The falling 20-day average and price below both moving averages keep the trend negative; the negative MACD confirms weak momentum; but oversold Stochastic readings and rising OBV argue against treating the setup as uniformly bearish. The verdict is invalidated if the price falls below HK$419.00 support.
- Ideal entry range: HK$417.57–HK$432.71, bounded by the lower Bollinger Band and 20-day average.
- Exit target: HK$447.85–HK$451.60, from the upper Bollinger Band to 20-session resistance.
- Stop-loss protection: Below HK$419.00 support.
For non-traders, the signals are mixed: Tencent is still in a downtrend, but nearby support and oversold readings leave room for a rebound that has not yet been confirmed.
| Indicator | Reading |
|---|---:|
| Last price | HK$423.00 |
| SMA20 / SMA50 | HK$432.71 / HK$447.28 |
| Bollinger lower / middle / upper | HK$417.57 / HK$432.71 / HK$447.85 |
| RSI(14) | 41.9 |
| Stochastic %K / %D | 14.0 / 15.3 |
| MACD / signal / histogram | -4.585 / -4.176 / -0.409 |
| ATR(14) | HK$12.04 |
| Support / resistance | HK$419.00 / HK$451.60 |
| Volume / 20-session average | 8,709,438 / 19,359,173 |
Summary Data Tencent
| Last price | 423.00 HKD |
| Change 1 day / 5 days / 1 month | 0.43% / -3.11% / -4.47% |
| Trend / MA-cross | downtrend / none |
| SMA20 / SMA50 | 432.71 / 447.28 |
| RSI (14) / Stochastic %K | 41.9 / 14.0 |
| Bollinger %B / ATR | 18% / 12.04 |
| Support / Resistance 20 days | 419.00 / 451.60 |
| Data as of | 5 Oktober 2026 08:30 WIB |
Track Tencent share price daily: live levels, support/resistance and our full Tencent analysis history.