UNH Stock Analysis: Gains 1.80%, Momentum Gains
On Oktober 6, 2026: price 378.58 USD, trend sideways, RSI 47.4, support 365.20, resistance 400.84. technical analysis of unh stock. UNH Stock Analysis — full…
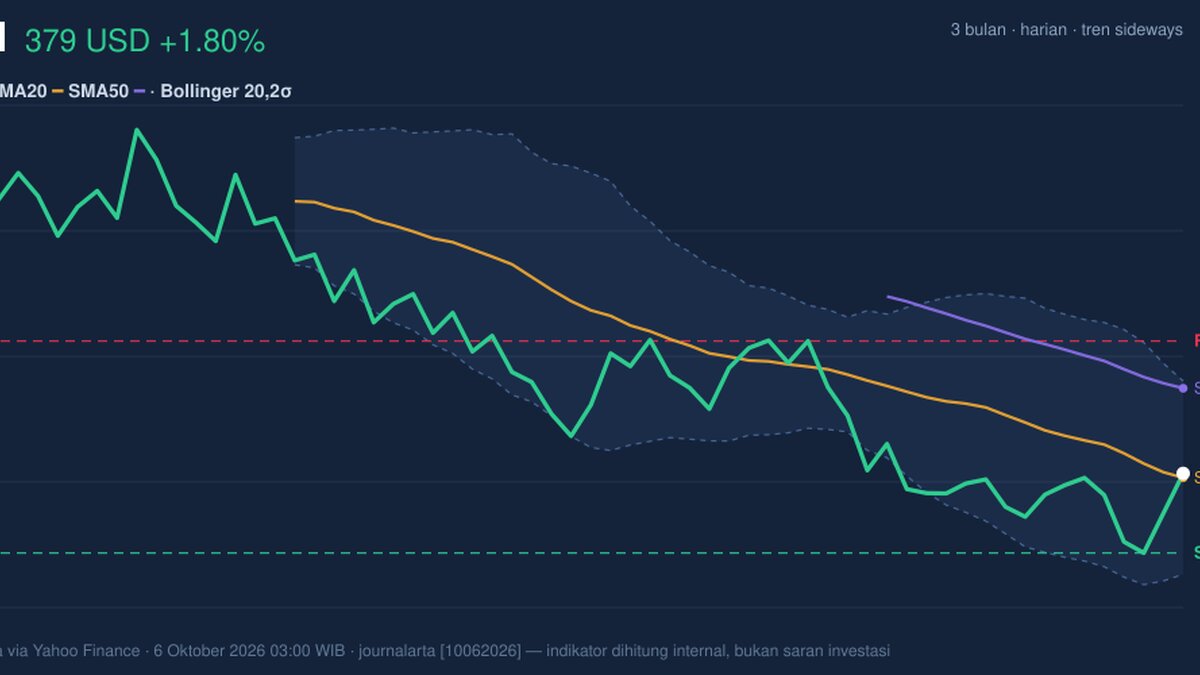
UnitedHealth Group rose 1.80% to $378.58 on the NYSE, putting the health insurer just above its 20-day average but still below its 50-day average. The rebound is modest. The latest session’s advance came with above-average volume, while the broader one-month decline and a downward-sloping short-term average point to a market still testing the strength of the recovery.
Trend & Price Action
UNH’s last price of $378.58 sits slightly above its 20-day simple moving average (SMA) of $377.85, a short-term reference for the recent average price. But it remains below the 50-day SMA at $392.90, so the share price has yet to reclaim a level that would signal firmer intermediate-term momentum. The 20-day average has fallen 1.64% over five days, a sign that the short-term trend is still soft despite the day’s gain. No new moving-average cross has formed.
The stock is up 0.20% over five days but down 4.67% over one month. That combination suggests a pause in the decline rather than a confirmed turn. UNH is also closer to the lower end of its 20-day trading range than the upper end: the 20-day support is $365.20 and resistance is $400.84, with the price 38% of the way through that range. Its three-month high and low—$461.62 and $362.60—show how far the stock has retreated from its recent peak, while its proximity to the low makes the nearby support area important.
As shown in the chart, the price is near the Bollinger middle band, which coincides with the 20-day average. This keeps the immediate picture balanced, but the declining SMA20 and position below the SMA50 limit the strength of the bullish interpretation.
Oscillators & Momentum
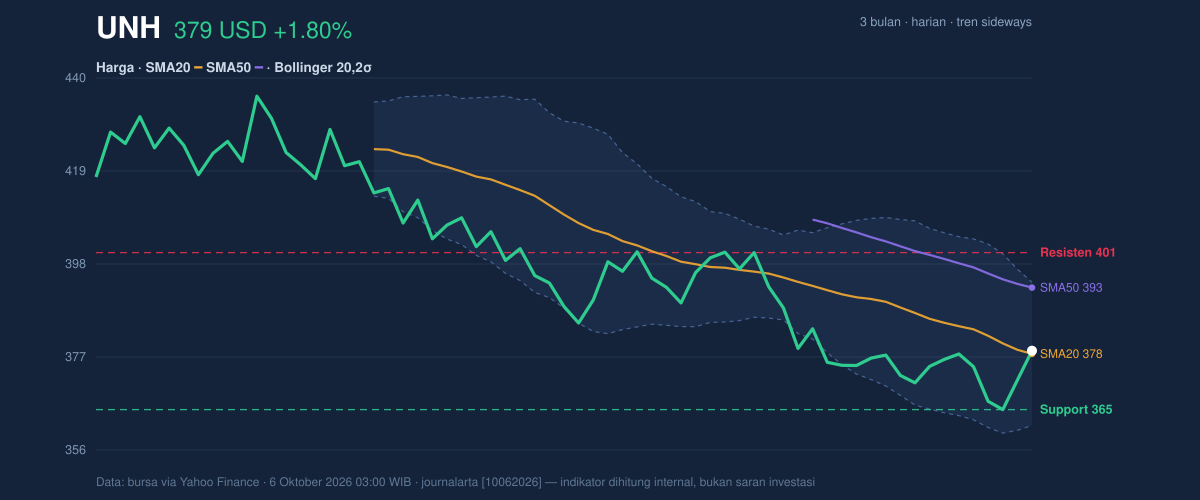
Momentum indicators are mixed. The RSI is neutral at 47.4; the Relative Strength Index measures the pace of price moves, and a reading near the middle of its scale offers little evidence of either strong buying pressure or a deeply oversold market.
The Stochastic is overbought, with %K at 85.0 and %D at 46.6. This indicator compares a closing price with its recent range. Its high %K suggests the latest rebound has run quickly, but the gap between the two lines means traders may watch for whether that strength holds or fades. It is not, by itself, proof that a reversal is underway.
The MACD momentum is positive but remains below zero: its reading is -6.181, above the signal line at -6.873, with a positive histogram of 0.692. MACD compares shorter- and longer-term price momentum. The improving relationship between the indicator and its signal line points to a near-term pickup, while both readings below zero show that the broader momentum picture has not yet turned decisively positive.
The chart brings that tension into focus: a positive MACD histogram and neutral RSI sit alongside an overbought Stochastic reading. The rebound has improved, but confirmation from price action is still needed.
Volatility, Volume & Key Levels
Bollinger Bands, which frame price around a moving average, are at $361.62 on the lower side and $394.09 on the upper side. UNH’s %B reading of 52% places it just above the middle of that band, not near either extreme. Band width is 8.6%, described by the data as normal, so there is no clear sign of unusually compressed volatility or a sharp volatility expansion. The 14-day Average True Range (ATR) is $7.54, or about 2.0% of the share price, indicating moderate daily movement rather than an especially calm or erratic market.
Volume was 5,823,300 shares, about 1.1 times the 20-day average of 5,096,960, while on-balance volume (OBV), a running measure of buying and selling volume, is rising. That supports the idea that the latest advance had some participation behind it. Still, one higher-volume session and rising OBV do not erase the weak one-month performance.
The key near-term test is whether UNH can hold the $365.20 support area and build above the $377.85 SMA20. A move through $392.90 would reclaim the SMA50; the next stated resistance is $400.84. If price fails to hold support, the three-month low of $362.60 is the next notable reference in the supplied data. A break below that level would further weaken the price structure.
Technical Verdict: HOLD (wait & see)
Core view: UNH’s indicators describe a tentative rebound inside a still-fragile trend, not a confirmed change in direction. The reasons are the price’s position below the SMA50 and declining SMA20, the positive but sub-zero MACD momentum, and the mixed oscillator signals: neutral RSI against an overbought Stochastic. This verdict is invalidated if the price falls below $362.60, the three-month low.
- Ideal entry range: $365.20–$377.85, anchored to the 20-day support and SMA20.
- Exit target: $392.90–$400.84, the SMA50 and 20-day resistance.
- Stop-loss protection: Below $362.60, the three-month low.
In plain English, the chart shows an early attempt to stabilize, but not yet enough evidence that the longer short-term decline has been reversed.
Data
Market data: exchange figures via Yahoo Finance, as of 6 October 2026, 03:00 WIB. Technical readings are based on the supplied price, moving-average, momentum, volatility and volume data.
Summary Data UNH
| Last price | 378.58 USD |
| Change 1 day / 5 days / 1 month | 1.80% / 0.20% / -4.67% |
| Trend / MA-cross | sideways / none |
| SMA20 / SMA50 | 377.85 / 392.90 |
| RSI (14) / Stochastic %K | 47.4 / 85.0 |
| Bollinger %B / ATR | 52% / 7.54 |
| Support / Resistance 20 days | 365.20 / 400.84 |
| Data as of | 6 Oktober 2026 03:00 WIB |
Track UNH stock price daily: live levels, support/resistance and our full UNH analysis history.