CapitaLand Ascendas REIT Stock Drops 0.45% on Wednesday, RSI Oversold
On October 7, 2026: price 2.21 SGD, trend downtrend, RSI 21.4, support 2.21, resistance 2.34. technical analysis of capitaland ascendas reit stock.
Why CapitaLand Ascendas REIT is in focus today
- Volume at 1.8× the 20-day average
- Closed at a 20-day low (2.21)
- Trading near its 3-month low (2.20)
- RSI(14) at 21.4 — oversold zone
- Downtrend extending (5-day change -2.21%)
- Not covered by JournalArta in the last 14 days
Selected automatically from 16 SGX (Singapore) stocks by a technical-signal score with daily weighted randomisation — not a recommendation.
Trend & Price Action
The decline extends a weak short-term trend: the unit price lost 2.21% over five days and 5.96% over one month. At S$2.21, it is below both its 20-day simple moving average (SMA) of S$2.29 and its 50-day average of S$2.39. The 20-day average is itself falling, down 1.59% over five days, a sign that recent weakness is not merely a one-session dip. No fresh crossover between the averages has occurred. The price sits at the bottom of its 20-day range, between support at S$2.21 and resistance at S$2.34, and just above its three-month low of S$2.20. That makes the next moves unusually consequential: holding this floor would stabilise the chart, while a break beneath it would put the three-month low in focus. A recovery, meanwhile, would first need to reclaim the declining 20-day average. As shown in the chart, the price is pressing the lower Bollinger Band, with the bands narrowing.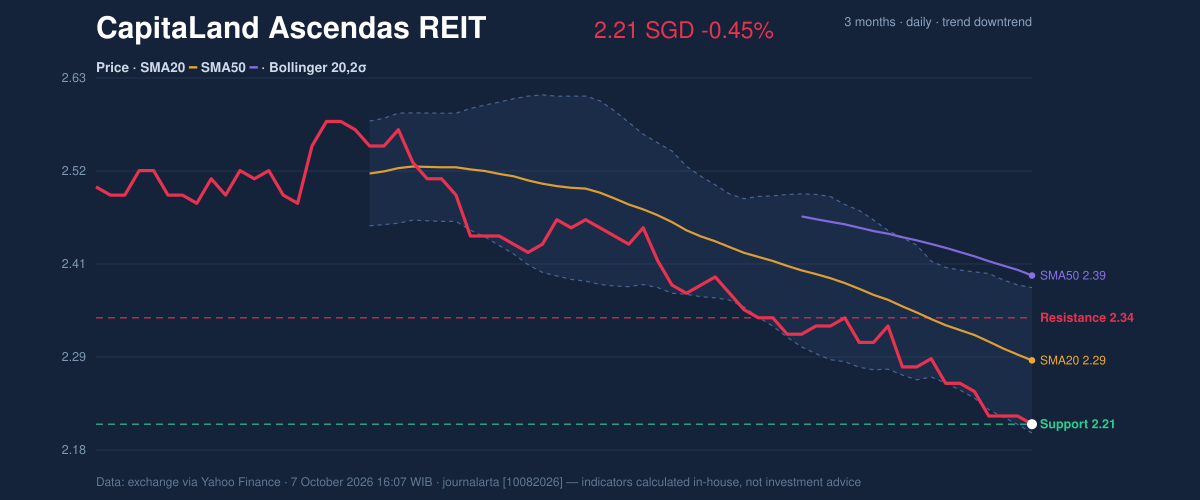
Oscillators & Momentum
The Relative Strength Index (RSI), which gauges the speed of recent price moves, is 21.4—below the conventional 30 threshold for an oversold reading. The Stochastic indicator is similarly depressed, with %K at 6.7 and %D at 7.0. Both readings signal oversold conditions, meaning selling has been intense; they are not, by themselves, proof that buyers have returned. The Moving Average Convergence Divergence (MACD), a trend-and-momentum measure, remains negative at -0.048 against a signal line of -0.044, with a negative histogram of -0.004. MACD still points to negative momentum, so the oversold readings are in tension with the prevailing trend rather than confirming a turn. A stronger reversal case would require momentum to improve alongside a price recovery.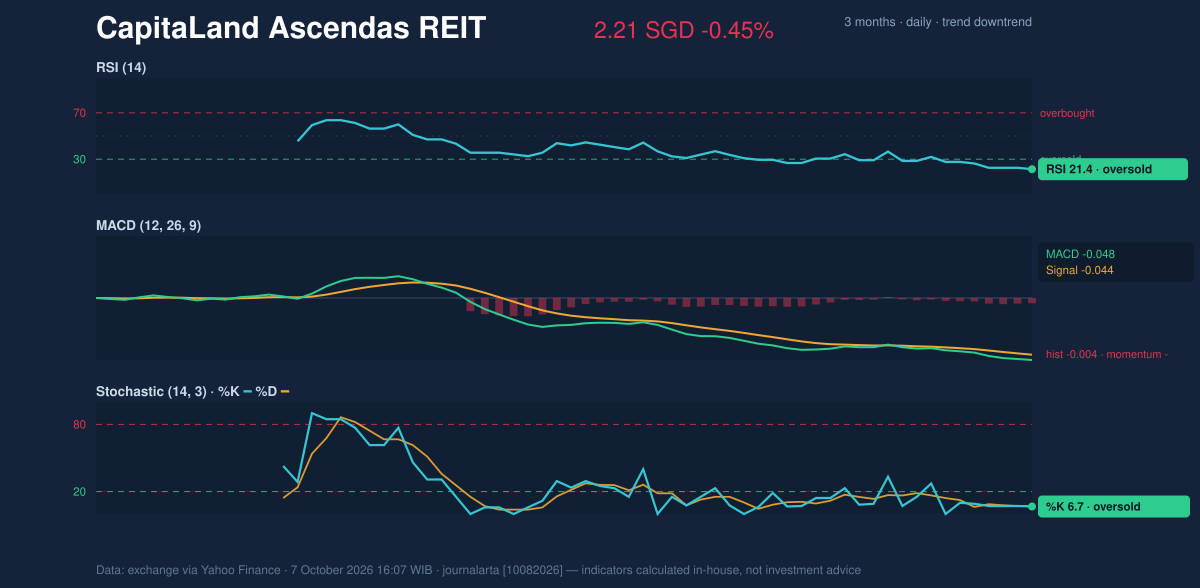
Volatility, Volume & Key Levels
The Bollinger %B reading is 6%, placing the price close to the lower band at S$2.20; the middle band is S$2.29 and the upper band S$2.38. Band width is 7.8% and narrowing. The squeeze signals compression, not direction: it can precede a larger move, but does not tell investors whether the next break will be up or down. Average True Range (ATR) is S$0.04, or 1.9% of the price, indicating moderate recent day-to-day movement. Volume reached 53,819,300 units, versus a 20-day average of 29,168,335. The 1.8-times volume surge shows heavier participation in the decline, while falling On-Balance Volume (OBV)—a measure that tracks whether trading volume accompanies rising or falling prices—offers no sign of accumulation. That weakens the case for treating oversold readings as an established bottom. The immediate level to watch is S$2.21 support, with the three-month low at S$2.20 close below it. A sustained break under S$2.20 would deepen the bearish signal; holding the floor and recovering S$2.34 resistance would be an initial improvement. Above that, the S$2.29 20-day average is a further test of whether the short-term trend is stabilising.Technical Verdict: HOLD (wait & see)
The indicators are mixed but lean weak: the price is below declining SMAs, MACD remains negative, and OBV is falling. Oversold RSI and Stochastic readings, together with support near the three-month low, argue against treating weakness as an unqualified continuation signal. - Indicative entry range: S$2.20–S$2.21, anchored to the three-month low and 20-day support. - Indicative exit target: S$2.34, the 20-day resistance level. - Stop-loss protection: Below S$2.20, the three-month low. - Invalidation condition: The HOLD verdict is invalidated if price breaks below S$2.20. In plain English, the chart is weak but stretched, so confirmation around the nearby floor matters more than the oversold readings alone. Market data: Singapore Exchange via Yahoo Finance, as of 7 October 2026, 16:07 WIB. Technical analysis is not an investment recommendation.Summary Data CapitaLand Ascendas REIT
| Last price | 2.21 SGD |
| Change 1 day / 5 days / 1 month | -0.45% / -2.21% / -5.96% |
| Trend / MA-cross | downtrend / none |
| SMA20 / SMA50 | 2.29 / 2.39 |
| RSI (14) / Stochastic %K | 21.4 / 6.7 |
| Bollinger %B / ATR | 6% / 0.04 |
| Support / Resistance 20 days | 2.21 / 2.34 |
| Data as of | 7 October 2026 16:07 WIB |
Disclaimer: This technical analysis is generated automatically from exchange data (via Yahoo Finance) and indicators calculated by JournalArta, for information and education only. The verdict and the entry, target and stop-loss levels are not investment advice or a solicitation to buy or sell any security. Investment decisions and their risks rest solely with the reader.
Track CapitaLand Ascendas REIT share price daily: live levels, support/resistance and our full CapitaLand Ascendas REIT analysis history.