HKEX Stock Technicals: Drops 0.26% on Wednesday, Testing Support Level
On October 7, 2026: price 379.00 HKD, trend downtrend, RSI 35.0, support 375.80, resistance 400.40. technical analysis of hkex stock. HKEX Stock Technicals —…
Why HKEX is in focus today
- Trading near its 3-month low (373.00)
- Downtrend extending (5-day change -2.02%)
- Not covered by JournalArta in the last 14 days
Selected automatically from 16 HKEX (Hong Kong) stocks by a technical-signal score with daily weighted randomisation — not a recommendation.
Trend & Price Action
HKEX is trading close to the lower end of its three-month range, between a high of 426.00 and a low of 373.00. Its 20-trading-day support at 375.80 is just below the latest price. That proximity matters: a hold could indicate that sellers are losing momentum near a recent floor, while a break would put the three-month low of 373.00 in focus. The Bollinger Bands, which track price relative to a moving average and recent volatility, have narrowed to a width of 7.1%. This squeeze can precede a larger move, but does not predict its direction. With the stock below the bands’ middle line at 389.78 and only 11% of the way from the lower to the upper band, the present setup leans weak rather than showing a confirmed rebound. The upper band at 403.62 is close to the 20-day resistance at 400.40, creating a substantial hurdle for any recovery.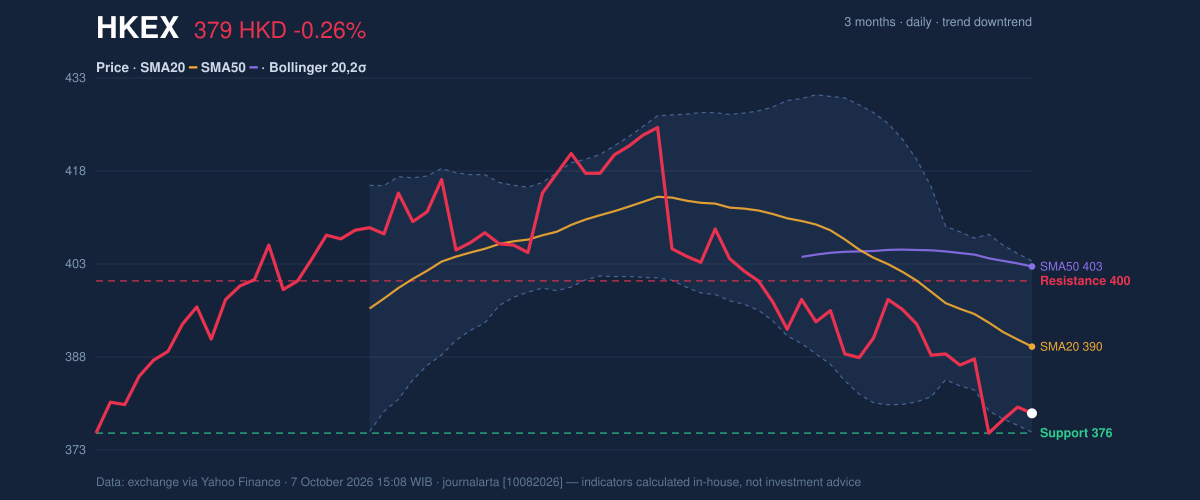
Oscillators & Momentum
Momentum indicators remain soft, although they do not yet show an unequivocal oversold reading. The RSI is 35.0, a neutral reading near the lower end of its scale; RSI measures the pace of recent gains and losses. The Stochastic oscillator is also neutral, with %K and %D both at 24.6. These readings suggest limited buying pressure, but neither on its own confirms a reversal. The MACD is more clearly negative: its reading of -6.491 is below its signal line at -5.391, while the histogram is -1.100. That configuration indicates downward momentum remains in place. A sustained improvement in these measures would strengthen the case that the decline is easing; for now, the oscillators do not override the falling trend.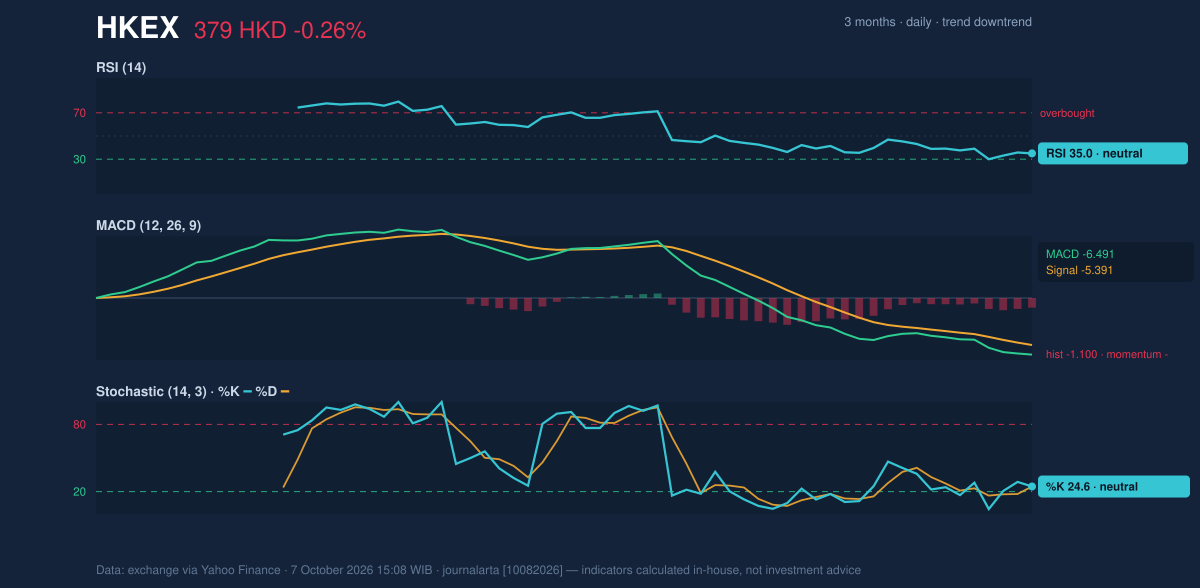
Volatility & Trading Activity
Average True Range, a measure of typical daily price movement, is 5.99, or about 1.6% of the share price, indicating moderate volatility. The narrower Bollinger Bands point to compressed recent movement, but a breakout would need confirmation from price and trading activity. The latest volume was 1,880,639 shares, only 0.6 times the 20-day average of 3,145,481, and On-Balance Volume is falling. Thin turnover makes the latest move less decisive: there is no strong surge in participation to confirm either a breakdown or a rebound. A recovery through resistance on firmer volume would carry more weight than a low-volume bounce.Key Levels & Scenarios
The immediate test is support at 375.80. If it holds, HKEX could attempt to recover toward resistance at 400.40, where the declining moving averages and upper Bollinger Band area create a cluster of potential supply. If support gives way, the three-month low at 373.00 is the next reference in the supplied data. A move above resistance would improve the chart, but would not by itself erase the broader downtrend while the stock remains below its moving averages.Technical Verdict: HOLD (wait & see)
The technical balance favors caution rather than a directional call. The verdict rests on three signals: the price remains below falling short-term and longer-term averages; MACD momentum is negative; and low volume with falling OBV offers no strong confirmation of a rebound. Against that, the stock is near three-month support and the Bollinger squeeze leaves room for a sharper move in either direction. The verdict is invalidated if the price breaks below 375.80. - Ideal Entry Range: HK$375.80–HK$389.78, bounded by 20-day support and the 20-day moving average. - Exit Target (Target Price): HK$400.40, the 20-day resistance level. - Stop Loss: Below HK$375.80, the support level used to define the setup. In plain English, the chart is near a floor, but it has not yet shown enough buying strength to confirm that the decline is over.| Indicator | Reading |
|---|---|
| Last price | HK$379.00 |
| Change | -0.26% (1 day); -2.02% (5 days); -5.72% (1 month) |
| SMA20 / SMA50 | 389.78 / 402.73 |
| Bollinger Bands | 403.62 / 389.78 / 375.94; %B 11%; width 7.1% |
| RSI / Stochastic | 35.0 / %K 24.6, %D 24.6 |
| MACD / signal / histogram | -6.491 / -5.391 / -1.100 |
| ATR(14) | 5.99 (1.6% of price) |
| Volume / 20-day average | 1,880,639 / 3,145,481 |
| 20-day support / resistance | 375.80 / 400.40 |
| Three-month high / low | 426.00 / 373.00 |
Summary Data HKEX
| Last price | 379.00 HKD |
| Change 1 day / 5 days / 1 month | -0.26% / -2.02% / -5.72% |
| Trend / MA-cross | downtrend / none |
| SMA20 / SMA50 | 389.78 / 402.73 |
| RSI (14) / Stochastic %K | 35.0 / 24.6 |
| Bollinger %B / ATR | 11% / 5.99 |
| Support / Resistance 20 days | 375.80 / 400.40 |
| Data as of | 7 October 2026 15:08 WIB |
Disclaimer: This technical analysis is generated automatically from exchange data (via Yahoo Finance) and indicators calculated by JournalArta, for information and education only. The verdict and the entry, target and stop-loss levels are not investment advice or a solicitation to buy or sell any security. Investment decisions and their risks rest solely with the reader.
Track HKEX share price daily: live levels, support/resistance and our full HKEX analysis history.