Testing Key Resistance, Singapore Airlines Stock Drops 0.30% on Wednesday
On October 7, 2026: price 6.68 SGD, trend sideways, RSI 44.5, support 6.48, resistance 6.74. technical analysis of singapore airlines stock.
By Alistair Sterling
October 7, 20264 min read
Testing Key Resistance, Singapore Airlines Stock Drops 0.30% on Wednesday
Data from Singapore’s exchange, carried by Yahoo Finance, showed Singapore Airlines at S$6.68 at 16:09 WIB on October 7, down 0.30% from the previous close. The stock is worth watching because JournalArta has not covered it in the past 14 days, while its price sits between a gently rising short-term rebound and a broader, still-soft trend: it is above its 20-day average but below its 50-day average.
That is a market in pause, not a confirmed turn.
Trend & Price Action
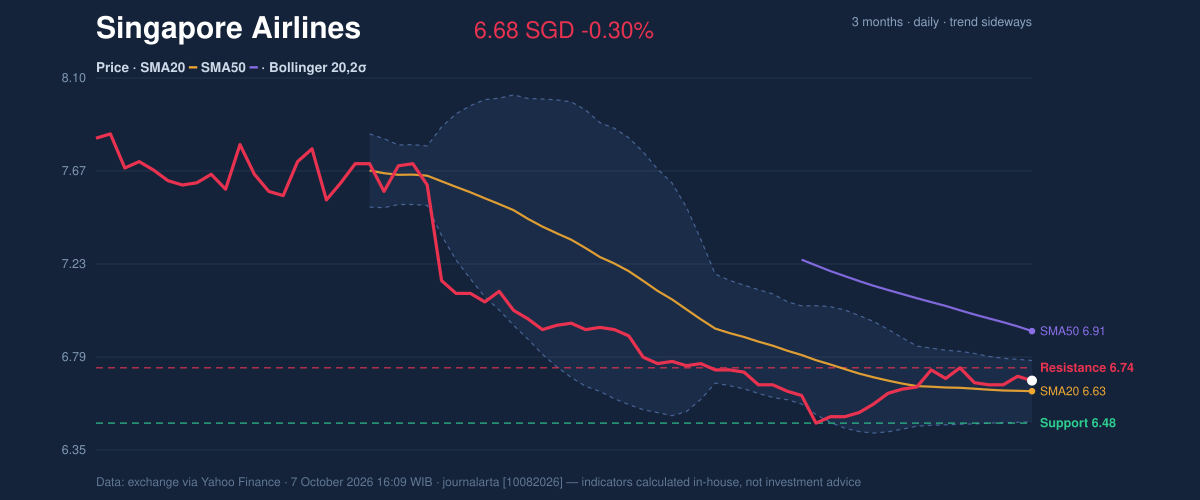
The shares have slipped 0.89% over five days and 0.60% over one month. Their sideways trend is reflected in the 20-day simple moving average, which has edged down 0.24% over five days. At S$6.68, the price is above the 20-day average of S$6.63, suggesting near-term support, but remains beneath the 50-day average of S$6.91, a sign that the longer trend has yet to strengthen. There is no recent moving-average crossover to confirm a change in direction.
The stock is at 77% of its 20-trading-day range, closer to resistance than support. Its three-month high and low stand at S$7.92 and S$6.46, respectively, placing the current price near the lower end of that wider span.
The chart shows the narrow trading corridor and the averages that define it.
3-month price action chart of Singapore Airlines: price, SMA20/50, Bollinger, support & resistance. Data: exchange via Yahoo Finance.
Oscillators & Momentum
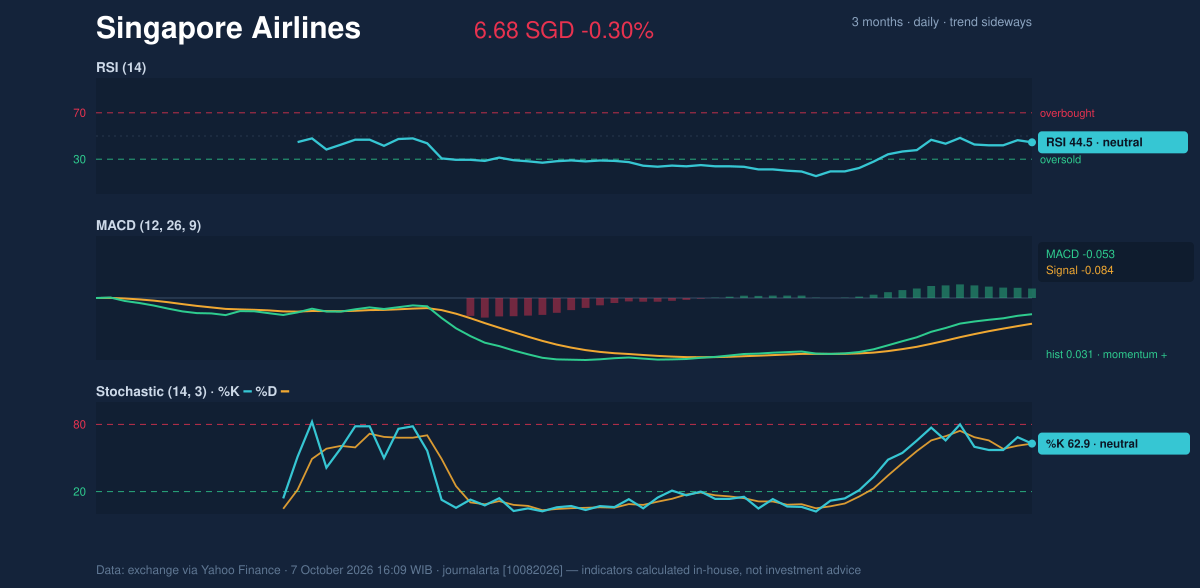
Momentum indicators are mixed but not strongly bearish. The 14-day relative strength index (RSI), which gauges the pace of recent price moves, is 44.5, a neutral reading. The Stochastic oscillator, which compares the latest close with recent trading levels, is also neutral at 62.9 for both %K and %D. Neither suggests an extreme condition or a clear reversal on its own.
The MACD offers a modestly more constructive signal. Its reading is -0.053, above the signal line at -0.084, while the histogram is positive at 0.031. That configuration indicates improving short-term momentum, even though the MACD remains below zero and the share price is still under its 50-day average. In plain terms, selling pressure may be easing, but the recovery has not yet established itself as a broader uptrend.
The momentum chart helps show that tentative improvement alongside neutral oscillators.
Momentum chart of Singapore Airlines: RSI(14), MACD, Stochastic. Data: exchange via Yahoo Finance.
Volatility, Volume & Key Levels
Bollinger Bands—an indicator that frames price within a moving range—are narrowing, with a 4.4% band width. The squeeze can precede a larger move in either direction; it does not predict which way the break will go. The price is at 67% of the band, below the upper boundary at S$6.77 and above the middle line at S$6.63. This places it in the upper half of the recent band, but not at an extreme.
Trading volume was 5.43 million shares, about 1.1 times the 20-day average of 4.74 million, while on-balance volume (OBV), a running measure that relates volume to price direction, is rising. That combination suggests some accumulation, but the modest excess over average volume is not decisive confirmation. Average true range (ATR), a measure of typical daily movement, is S$0.10, or 1.5% of the price—moderate volatility.
The 20-day support at S$6.48 is close to the three-month low of S$6.46, making that area the key downside test. On the upside, S$6.74 resistance is just below the Bollinger upper band. A sustained move above that zone would put the 50-day average at S$6.91 in view; failure to hold S$6.48 would weaken the case that the current consolidation is stabilising.
Technical Verdict: HOLD (wait & see)
The indicators favour patience rather than a directional call. The price is above its 20-day average and MACD momentum is positive, but the 20-day average is sloping down, the price remains below the 50-day average, and resistance at S$6.74 has not been cleared. The narrowing Bollinger Bands raise the possibility of a sharper move, without confirming its direction.
- Indicative entry range: S$6.48–S$6.63, around 20-day support and the 20-day average.
- Indicative exit target: S$6.74, the 20-day resistance; S$6.91, the 50-day average, is a further reference if resistance gives way.
- Indicative stop-loss protection: below S$6.46, the three-month low; a break below S$6.48 support would invalidate the holding thesis.
For non-traders, the signals show a stock trying to steady itself, but not yet strong enough to confirm a sustained recovery.
Data table
Indicator
Reading
Last price
S$6.68
Daily / five-day / one-month change
-0.30% / -0.89% / -0.60%
SMA20 / SMA50
S$6.63 / S$6.91
RSI(14)
44.5, neutral
Stochastic %K / %D
62.9 / 62.9, neutral
MACD / signal / histogram
-0.053 / -0.084 / 0.031
Bollinger upper / middle / lower
S$6.77 / S$6.63 / S$6.49
20-day support / resistance
S$6.48 / S$6.74
Volume / 20-day average
5,426,200 / 4,739,469
Summary Data Singapore Airlines
Last price
6.68 SGD
Change 1 day / 5 days / 1 month
-0.30% / -0.89% / -0.60%
Trend / MA-cross
sideways / none
SMA20 / SMA50
6.63 / 6.91
RSI (14) / Stochastic %K
44.5 / 62.9
Bollinger %B / ATR
67% / 0.10
Support / Resistance 20 days
6.48 / 6.74
Data as of
7 October 2026 16:09 WIB
Disclaimer: This technical analysis is generated automatically from exchange data (via Yahoo Finance) and indicators calculated by JournalArta, for information and education only. The verdict and the entry, target and stop-loss levels are not investment advice or a solicitation to buy or sell any security. Investment decisions and their risks rest solely with the reader.