OCBC Stock Technicals: Drops 5.90% on Wednesday, Testing Support Level
On October 7, 2026: price 30.30 SGD, trend sideways, RSI 38.6, support 30.30, resistance 32.22. technical analysis of ocbc stock. OCBC Stock Technicals — full…
Trend & Price Action
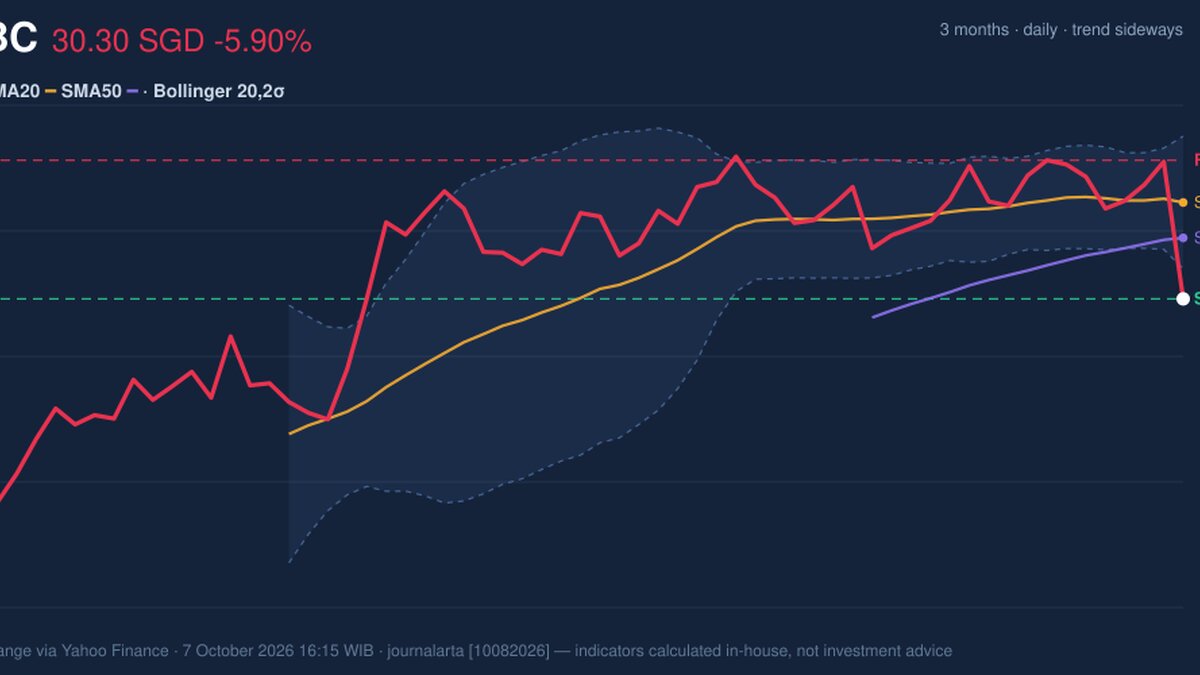
The day’s drop extended OCBC’s declines over five trading days and one month, leaving the share price below both its 20-day simple moving average (SMA) of S$31.63 and its 50-day average of S$31.15. The 20-day average is falling slightly, while there has been no new crossover between the two averages. In plain terms, the broader setup is sideways, but the immediate price action has weakened. At S$30.30, the shares are at the stated 20-day support and at the bottom of the 20-day trading range. The price is also below the lower Bollinger Band at S$30.72. Bollinger Bands widen and narrow with price volatility; the current 5.8% width had been tightening, a condition often called a squeeze. The sharp move below the band marks a break from that compression, but does not by itself establish whether the next move will continue lower or reverse.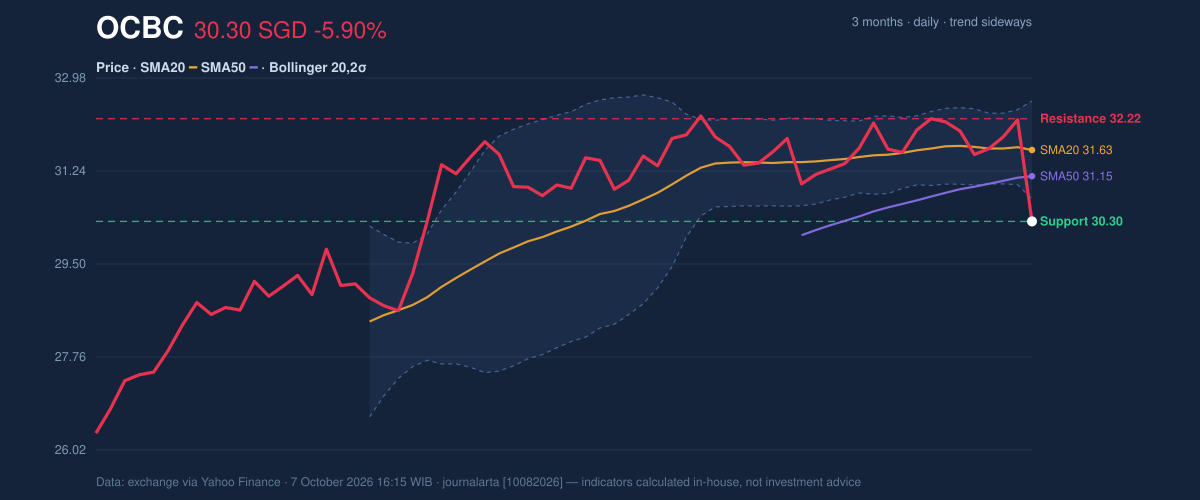
Oscillators & Momentum
Momentum indicators offer mixed evidence. The RSI is 38.6, a neutral reading, indicating weaker momentum without a clear oversold signal from that measure. The Stochastic is oversold, with %K at 8.1 against %D at 54.0; this points to a sharp recent loss of momentum, though an oversold reading alone does not confirm a rebound. The MACD is negative in momentum terms: its histogram is -0.139, with the MACD at 0.112 below the signal line at 0.252. The gap indicates downside pressure remains in the short-term trend. A possible tension is emerging between the deeply oversold Stochastic and the negative MACD: the former says the fall has been steep, while the latter has not yet confirmed a turn.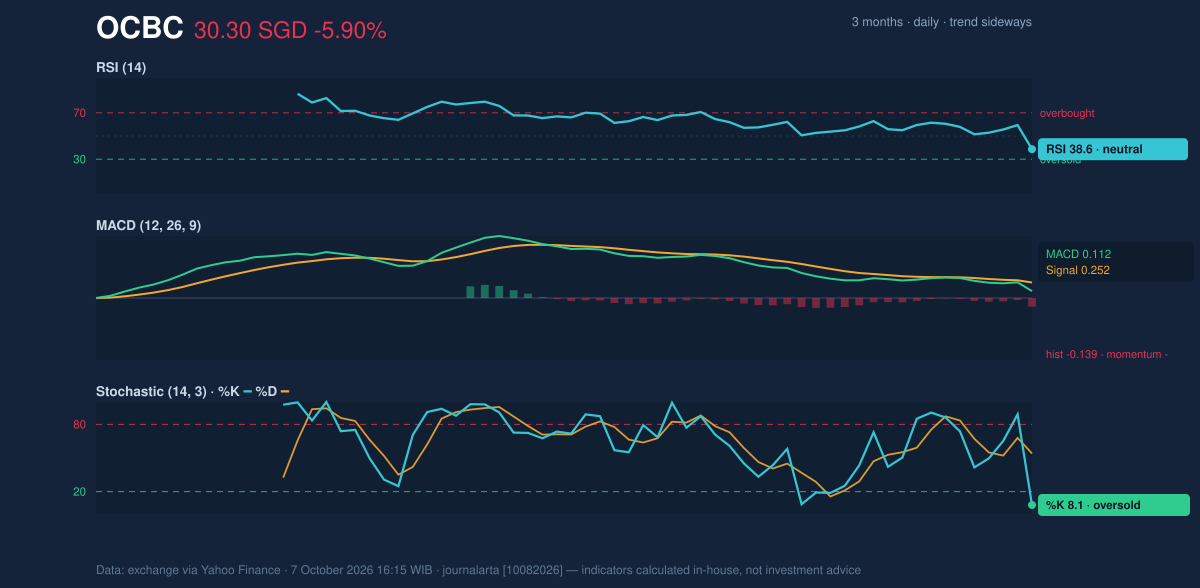
Volatility, Volume & Key Levels
The Bollinger squeeze has given way to a downside break, with the price below the lower band. The 14-day average true range (ATR), a measure of typical daily movement, is S$0.57, or 1.9% of the share price. That is consistent with moderate volatility, but the session’s unusually large decline shows that actual moves can exceed the recent average. Volume rose to 27,116,720 shares, against a 20-day average of 7,189,745, while on-balance volume (OBV) fell. OBV combines price direction and volume to gauge whether trading activity is accumulating or distributing shares. Its decline alongside the volume surge supports the interpretation that the session was dominated by selling rather than quiet price drift. The immediate level to watch is S$30.30 support. A sustained move below it would put the recent range floor under pressure; the three-month low of S$25.50 is a broader reference, not a guaranteed destination. On a recovery, S$30.72, the lower Bollinger Band, is the first reference, followed by S$31.15–S$31.63, the 50-day and 20-day averages. The 20-day resistance is S$32.22. A move back above those averages would ease the near-term weakness, while failure to hold support would leave the downside break in place.Technical Verdict: HOLD (wait & see)
The indicators do not yet align for a directional verdict. The price has broken below its lower Bollinger Band on heavy volume, OBV is falling, and the MACD histogram is negative; against that, the Stochastic is oversold, which leaves room for a short-term recovery but does not confirm one. - Ideal entry range: S$30.72–S$31.15, the lower Bollinger Band to the 50-day SMA, if price stabilises in that area. - Exit target: S$31.63–S$32.22, from the 20-day SMA to 20-day resistance. - Stop-loss protection: below S$30.30, the stated 20-day support. - Invalidation: the HOLD view is invalidated if price breaks below S$30.30 support. For non-traders, HOLD means the signals are mixed: the sell-off is forceful, but a rebound is not yet confirmed.Data: Exchange data via Yahoo Finance, as of Oct. 7, 2026, 16:15 WIB. Technical analysis is not an investment recommendation.
Why OCBC is in focus today
- One-day move of -5.90%, about 3.1× its average daily range (ATR)
- Volume at 3.8× the 20-day average
- Breaking out of a Bollinger squeeze (band width 5.8%)
Selected automatically from 16 SGX (Singapore) stocks by a technical-signal score with daily weighted randomisation — not a recommendation.
Summary Data OCBC
| Last price | 30.30 SGD |
| Change 1 day / 5 days / 1 month | -5.90% / -5.28% / -3.35% |
| Trend / MA-cross | sideways / none |
| SMA20 / SMA50 | 31.63 / 31.15 |
| RSI (14) / Stochastic %K | 38.6 / 8.1 |
| Bollinger %B / ATR | -23% / 0.57 |
| Support / Resistance 20 days | 30.30 / 32.22 |
| Data as of | 7 October 2026 16:15 WIB |
Disclaimer: This technical analysis is generated automatically from exchange data (via Yahoo Finance) and indicators calculated by JournalArta, for information and education only. The verdict and the entry, target and stop-loss levels are not investment advice or a solicitation to buy or sell any security. Investment decisions and their risks rest solely with the reader.
Track OCBC share price daily: live levels, support/resistance and our full OCBC analysis history.